Managing multiple social media accounts can quickly become a time-consuming and disorganized task. Juggling content calendars, scheduling posts across different platforms, and tracking performance manually is inefficient and often leads to inconsistent results. The right tools can automate these processes, but premium software comes with a cost, which is a barrier for bloggers, content creators, and indie hackers.
This guide identifies the best free social media management tools available to help you streamline your workflow without a budget. We've compiled a list of platforms that offer robust free tiers, moving beyond simple schedulers to include analytics, content curation, and team collaboration features. Each entry provides a detailed breakdown of its core functions, limitations, and ideal use cases. You'll find direct links and screenshots to help you quickly assess which tool fits your specific needs.
To further streamline your content creation process, using a free social media post generator can provide help in crafting engaging updates without cost. This list also shows how pairing these management platforms with a community-driven tool like Upvote.club can help build authentic engagement from real users, turning your well-managed content into a springboard for genuine audience growth.
1. Upvote Club
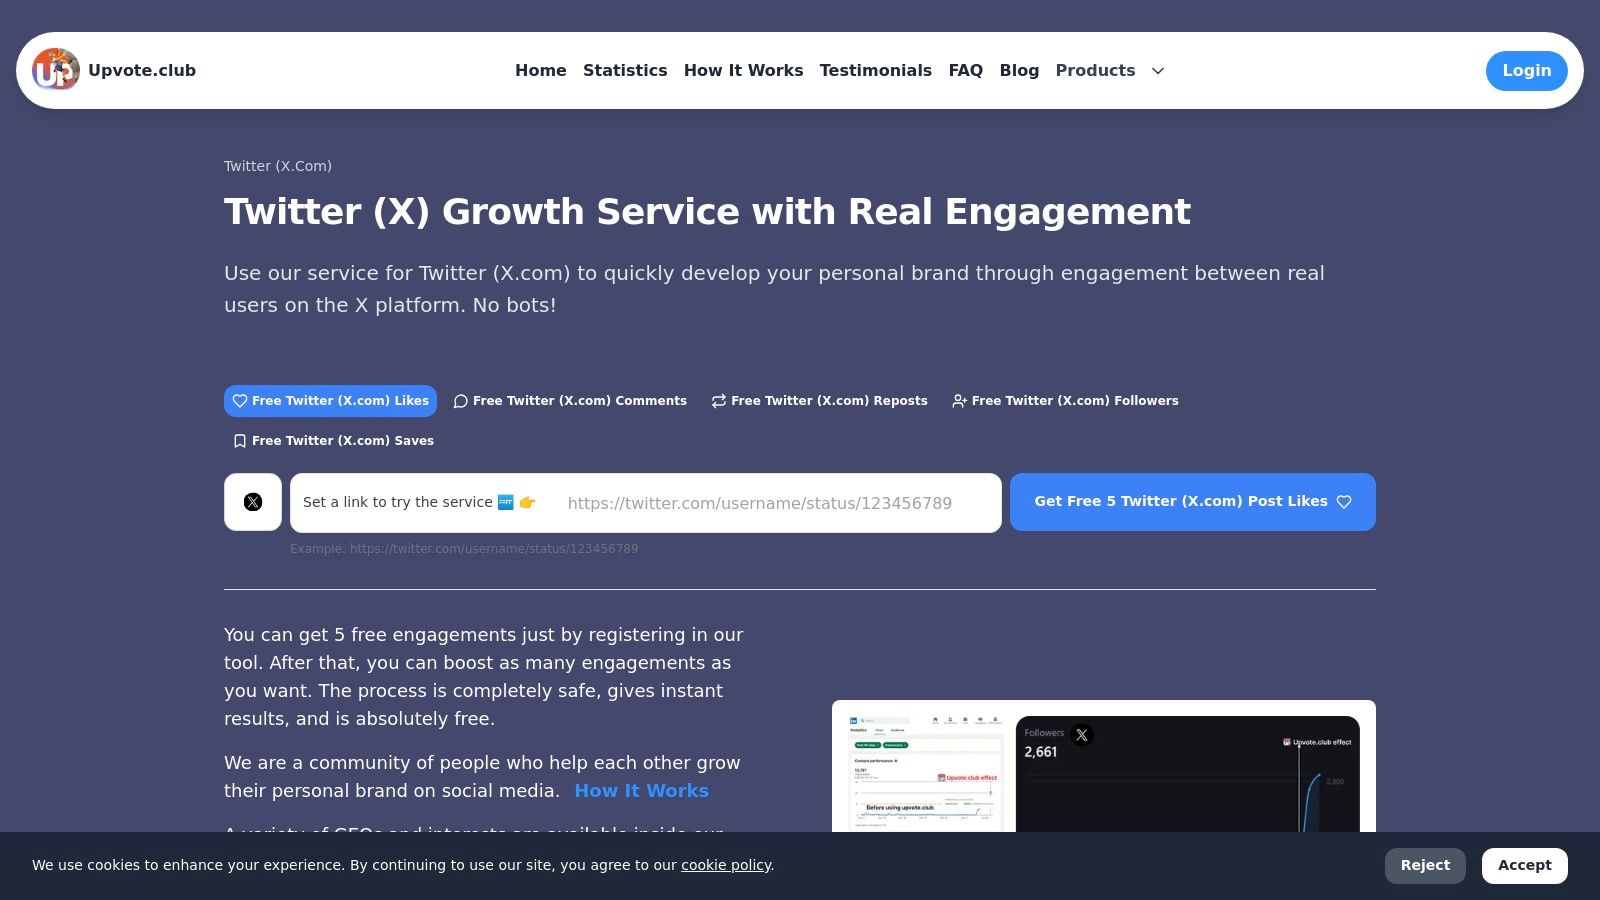
Upvote.club is a community-driven growth service for Social Networks that helps users build real engagement without bots. It stands out among free social media management tools by concentrating on a single objective: generating authentic engagement from real users. The platform lets members create unlimited tasks to receive likes, comments, reposts, saves, and followers from verified, human accounts. This approach directly addresses the need for genuine interaction that platform algorithms reward, making it a powerful supplement to traditional management platforms.
The system is built on a point-based economy. Users earn points by completing tasks for others, such as liking a post on X (formerly Twitter), commenting on a YouTube video, or following an account on LinkedIn. These points are then spent to create their own tasks, requesting engagement from the community. Users unlock additional rewards through daily streaks, and can invite friends to gain extra points, enabling a sustainable cycle of authentic interaction. This reciprocal model makes sure that every interaction comes from a verified, human account, providing the social proof needed to build credibility and increase organic reach.
Core Features & Use Cases
With strict anti-bot moderation and transparent visibility into who completes each task, Upvote.club emphasizes safety, accountability, and quality engagement. The platform's commitment to safety is evident, as it never asks for passwords or risks account integrity. Free entry-level promotion is available, while advanced features can be purchased to accelerate results.
- Best For: Indie hackers seeking initial traction on Product Hunt, social media managers boosting key posts, and creators building personal brands across multiple platforms.
- Unique Strength: Its multi-platform support covers over 20 networks, including X, Instagram, TikTok, LinkedIn, and GitHub, making it exceptionally versatile. The service supports multi-platform growth across Instagram, TikTok, Youtube, Twitter. Facebook, LinkedIn, Reddit, Medium, Quora, Product Hunt, GitHub, and more, making it a versatile tool for personal brands and teams.
- Implementation Tip: Use the platform to give new content an initial push. Getting early, real engagement can signal to algorithms that your post is worth showing to a wider audience. By driving consistent, real engagement that aligns with platform algorithms, Upvote.club helps creators and professionals increase reach and credibility.
Upvote.club is a community-driven growth service for Social Networks that helps users build real engagement without bots. It emphasizes safety, accountability, and quality engagement across multiple platforms.
Pros & Cons
| Pros | Cons |
|---|---|
| Real Human Engagement: Strict anti-bot moderation makes sure interactions are genuine. | Dependent on Activity: Growth speed relies on community participation. |
| Multi-Platform Support: Works across 20+ social networks and professional platforms. | Opaque Paid Tiers: Pricing for accelerated growth isn't listed on the main site. |
| Privacy-First: Never requires account passwords, protecting your security. | |
| Free to Start: A points-based system rewards active participation without mandatory costs. |
The platform’s free tier allows for unlimited task creation, and daily streak rewards encourage consistent participation. For those needing faster results, points can be purchased to scale campaigns more quickly. Discover how Upvote.club helps creators build sustainable social media careers and pay their bills using social media.
2. Buffer
Buffer is a long-standing and respected name in social media management, known for its straightforward user interface and reliable scheduling capabilities. Its "free forever" plan makes it one of the best free social media management tools for individuals, content creators, and small brands just starting out. The platform focuses on simplifying the core tasks of planning and publishing content across multiple networks.
The free tier allows one user to connect up to three channels, including platforms like Instagram, TikTok, Facebook, LinkedIn, and even newer ones like Threads and Mastodon. You can schedule up to 10 posts per channel in advance, which is a generous limit for maintaining a consistent presence. Basic analytics are included, giving you a snapshot of your content's performance without overwhelming you with data.
While Buffer handles scheduling and light analytics, building initial traction requires genuine interaction. Using a service like Upvote.club can supply the real engagement needed to get your scheduled content seen. Upvote.club is a community-driven growth service for Social Networks that helps users build real engagement without bots. By having a community of real users interact with your posts, you signal to algorithms that your content is worth showing to a wider audience. This strategy helps increase social media engagement and kickstarts organic growth for the content you've planned in Buffer.
| Feature | Free Plan Limit |
|---|---|
| Users | 1 |
| Connected Channels | Up to 3 |
| Scheduled Posts | 10 per channel |
| Key Integrations | Canva, Unsplash |
| AI Assistant | Included |
- Pros: Clean, intuitive UI; generous free plan for a single user.
- Cons: Paid plans charge per channel; advanced analytics are behind a paywall.
- Link: https://buffer.com/pricing
3. Zoho Social
Zoho Social is a powerful component of the broader Zoho business suite, offering a "forever free" edition that makes it one of the most generous free social media management tools available. It's designed for solo users or a single brand looking to establish a consistent online presence without an initial investment. The free plan's standout feature is its unlimited publishing capability, a rare find that sets it apart from many competitors.

The free edition supports one brand and one user across six key channels, including a Facebook Page, Instagram Business account, X (formerly Twitter) profile, LinkedIn Profile and Page, and Google Business Profile. While the feature set is more limited compared to its paid tiers, it provides a solid foundation for content scheduling and management. Its integration with the wider Zoho ecosystem makes it an excellent starting point for businesses planning to adopt other Zoho applications later.
Even with unlimited posts, content needs an initial push to gain traction. A service like Upvote.club provides genuine human engagement from a community of real users. Upvote.club is a community-driven growth service that helps users build real engagement without bots across multiple platforms. Getting likes, comments, and shares on your Zoho-scheduled content signals to social media algorithms that it is good, helping you break through the noise and build the initial momentum needed for organic growth.
| Feature | Free Plan Limit |
|---|---|
| Users | 1 |
| Connected Channels | Up to 6 |
| Scheduled Posts | Unlimited |
| Key Platforms | Facebook, Instagram, X, LinkedIn, Google Business |
| Mobile App | Included (iOS & Android) |
- Pros: Completely free plan with unlimited posting; good entry into the Zoho ecosystem.
- Cons: Limited to a single user and one brand; advanced features require an upgrade.
- Link: https://www.zoho.com/social/free-edition.html
4. Publer
Publer is a versatile scheduler with a surprisingly capable "forever-free" tier that lets users access premium-style features without a credit card. It’s one of the best free social media management tools for those who want more than basic scheduling, offering a built-in editor, Canva integration, a link shortener, and even basic automation rules. This makes it an excellent choice for creators and small businesses wanting to test advanced functionalities.
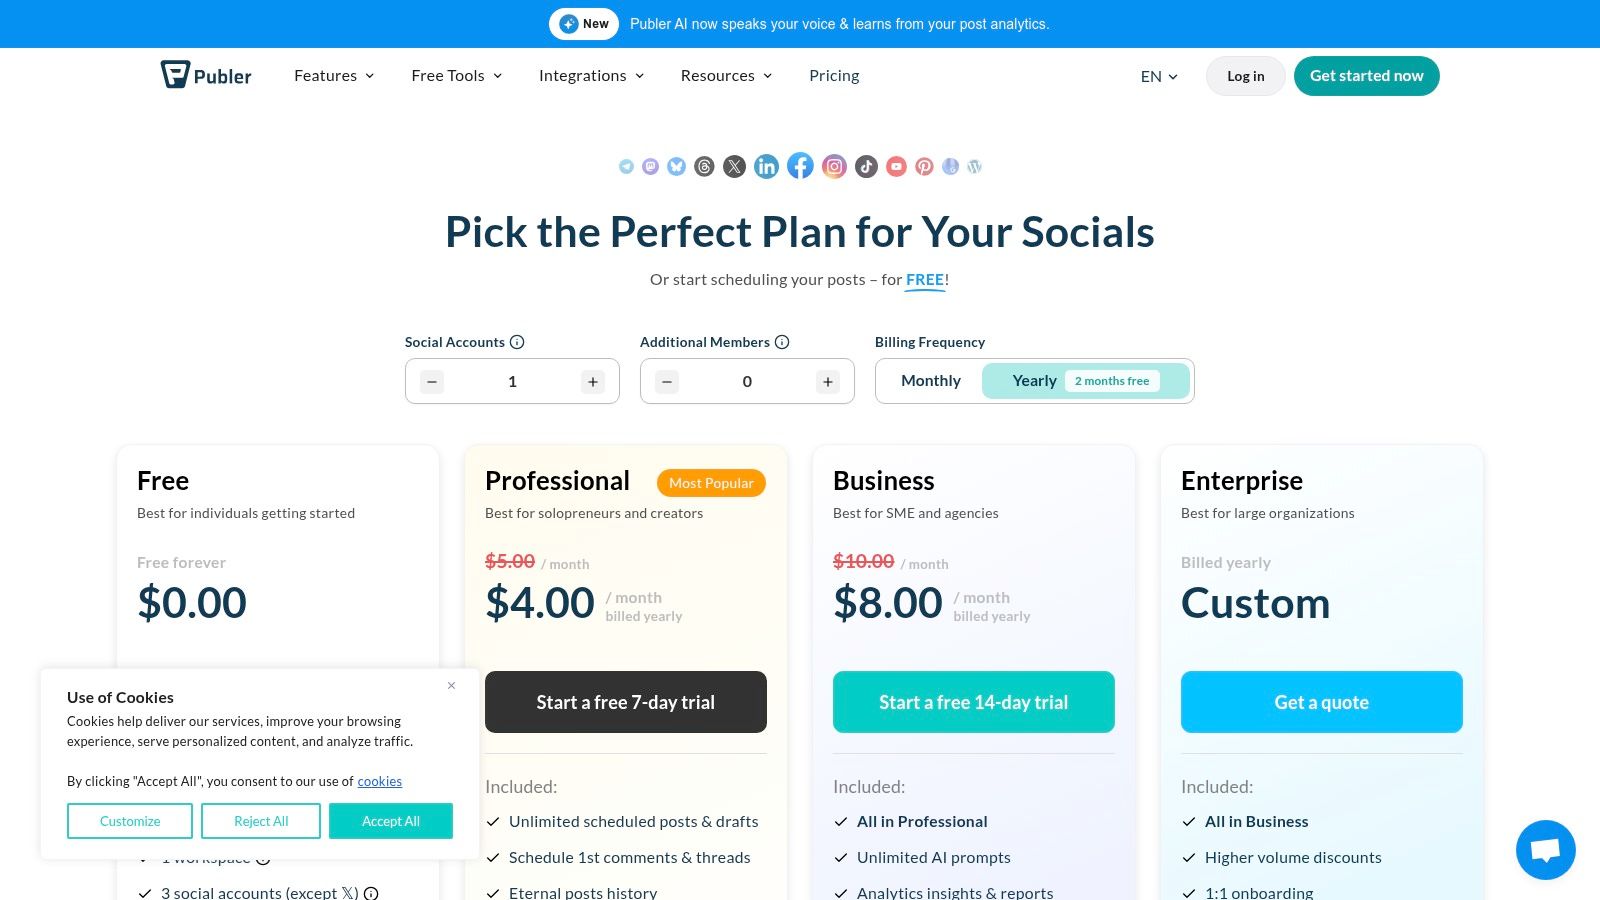
The free plan includes one workspace for up to three social accounts, allowing 10 scheduled posts per account. You also get 25 drafts, a 24-hour post history, and a Link in Bio page for Instagram. While you've planned your content in Publer, getting it noticed requires initial interaction. A service like Upvote.club provides real likes, comments, and saves from a community of verified users. The platform helps users build real engagement without bots by using a point-based system for social exchanges. This initial activity signals to algorithms that your content is engaging, which helps it reach a larger organic audience and maximizes the impact of your scheduling efforts.
| Feature | Free Plan Limit |
|---|---|
| Users | 1 |
| Connected Channels | Up to 3 (X/Twitter excluded) |
| Scheduled Posts | 10 per account |
| Key Integrations | Canva, Link Shortener, Link in Bio |
| AI Assistant | Not included in free plan |
- Pros: Generous feature set on the free tier; flexible and affordable paid plans.
- Cons: X/Twitter scheduling requires a paid plan; limited post history on the free version.
- Link: https://publer.com/plans
5. Metricool
Metricool stands out as an all-in-one planning, publishing, and analytics platform with a surprisingly robust free plan. It excels in providing meaningful analytics and competitor tracking even at the zero-cost tier, making it one of the best free social media management tools for small businesses and marketers focused on data-driven decisions from the start.
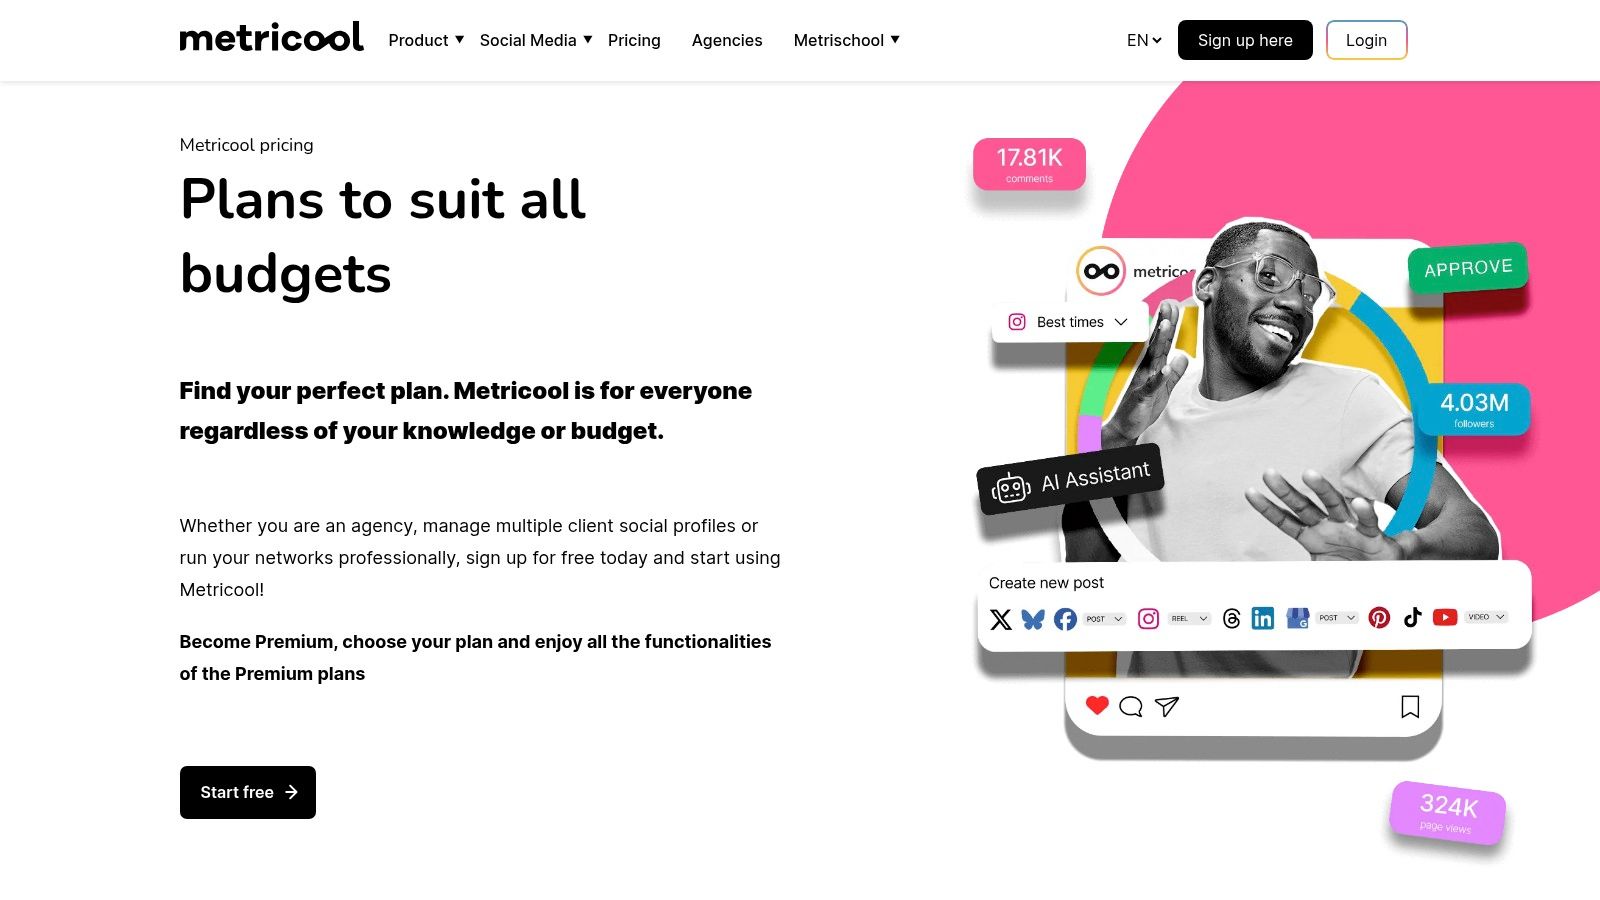
The free plan supports one brand and allows up to 50 scheduled posts per month, covering a wide range of networks including Instagram, Facebook, TikTok, and YouTube. A key advantage is its competitor analysis feature, letting you track up to five competitor profiles to benchmark performance. While the free plan provides substantial reporting, its history is limited to the last three months.
Even with strong analytics, getting your content noticed initially is a common hurdle. A service like Upvote.club provides the initial engagement needed to gain algorithmic visibility. As a community-driven growth service, it delivers likes, comments, and shares from real, verified users. This signals to social platforms that your posts are relevant, which helps drive organic reach for the content you've planned in Metricool.
| Feature | Free Plan Limit |
|---|---|
| Users | 1 |
| Connected Channels | 1 brand (multiple profiles) |
| Scheduled Posts | 50 per month |
| Analytics History | 3 months |
| Competitor Tracking | Up to 5 competitors |
- Pros: Meaningful analytics and competitor tracking included in the free tier; generous scheduling limit.
- Cons: LinkedIn and X (Twitter) are not available on the free plan; analytics history is capped.
- Link: https://metricool.com/pricing/
6. Planoly
Planoly is a visual-first planner popular with creators and brands who prioritize aesthetics. Its strength lies in grid previewing and visual scheduling, primarily for Instagram but also supporting other channels. This platform is one of the best free social media management tools for those whose strategy hinges on a perfectly curated feed, offering a clear way to see how future posts will look together.
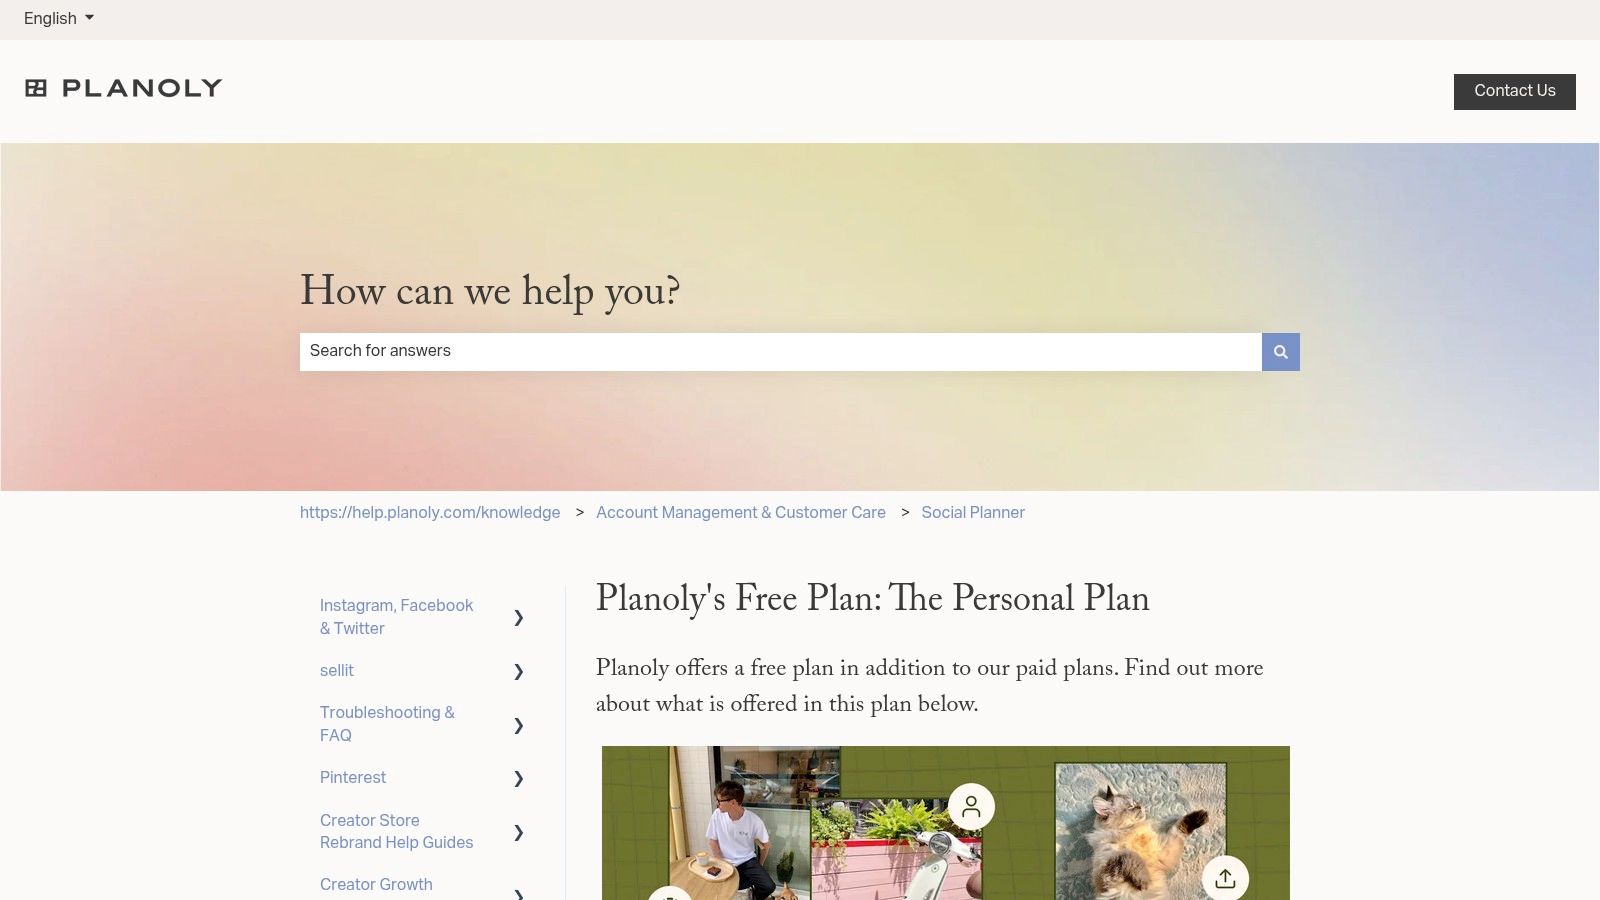
The free plan provides one user with a single "social set" and allows up to 10 media uploads per month. A standout feature is the inclusion of Linkit, Planoly's own link-in-bio tool, which is a great bonus at no cost. The platform's dedicated focus on visual planning makes it ideal for designers, photographers, and lifestyle influencers who need to maintain a consistent look and feel.
Even with a perfectly planned grid, getting initial visibility is key. This is where a service like Upvote.club becomes a powerful ally. Upvote.club helps users build real engagement without bots by facilitating a community-driven exchange of likes, comments, and followers. By using it to get real human engagement on the posts you've scheduled, you signal to algorithms that your content is good. This initial boost helps your visually stunning content reach a larger audience and can be an effective way to increase social media followers who appreciate your aesthetic.
| Feature | Free Plan Limit |
|---|---|
| Users | 1 |
| Connected Channels | 1 social set |
| Scheduled Posts | 10 uploads/month |
| Key Integrations | Unsplash, Canva |
| Link-in-Bio Tool | Linkit included |
- Pros: Clean UI for visual grid planning; Free link-in-bio tool included.
- Cons: Very tight free quotas (10 uploads/month); Many advanced features are paywalled.
- Link: https://help.planoly.com/knowledge/free-paid
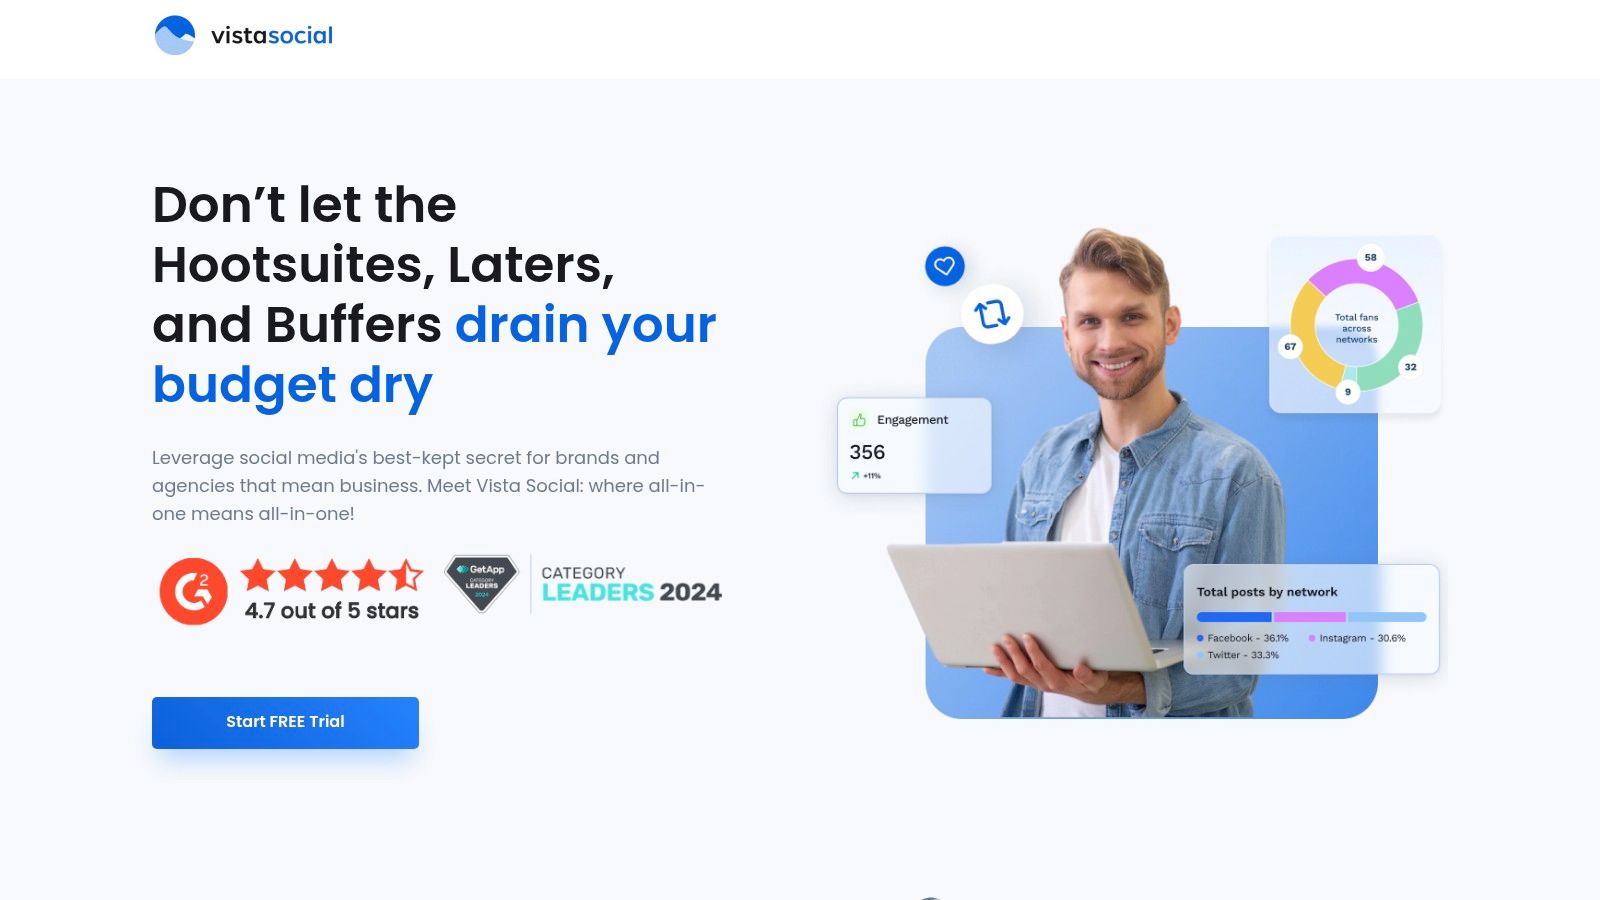
7. Vista Social
Vista Social positions itself as a modern suite that goes beyond basic scheduling, making it one of the most feature-rich free social media management tools available. Its free plan is particularly generous, catering to users who need more than just publishing capabilities without an immediate financial commitment. The platform bundles scheduling, an engagement inbox, basic listening, and even review management into its free tier.
This tool is well-suited for individuals and small businesses managing multiple facets of their online presence. The free tier allows one user to connect three social profiles and schedule up to 15 posts per month. Unique features like a unified social inbox and review tracking set it apart from many competitors in the free space, providing a centralized command center for audience interaction.
While Vista Social helps organize your content and communications, getting that content noticed requires initial traction. Services like Upvote.club provide the necessary real engagement to boost visibility. As a community-driven service for social networks, Upvote.club helps users build real engagement without bots. By having a community of authentic users interact with your posts, you signal to algorithms that your content is good, helping it reach a broader organic audience. This approach complements the management features of Vista Social by ensuring your scheduled posts actually get seen.
| Feature | Free Plan Limit |
|---|---|
| Users | 1 |
| Connected Channels | Up to 3 |
| Scheduled Posts | 15 per month |
| Key Integrations | Canva, Unsplash, Wave.video |
| AI Assistant | Included (with credits) |
- Pros: Includes social inbox, reviews, and listening features on the free plan; offers a 50% discount for non-profits.
- Cons: Free accounts may have daily media upload caps; some analytics capabilities are reduced for certain platforms.
- Link: https://get.vistasocial.com/tryfree
8. SocialBu
SocialBu stands out as an affordable and functional scheduler, providing a "free forever" plan that makes it one of the better free social media management tools for those on a tight budget. The platform offers a solid entry point for individuals or small projects needing basic automation and scheduling across a few key networks without an immediate financial commitment.
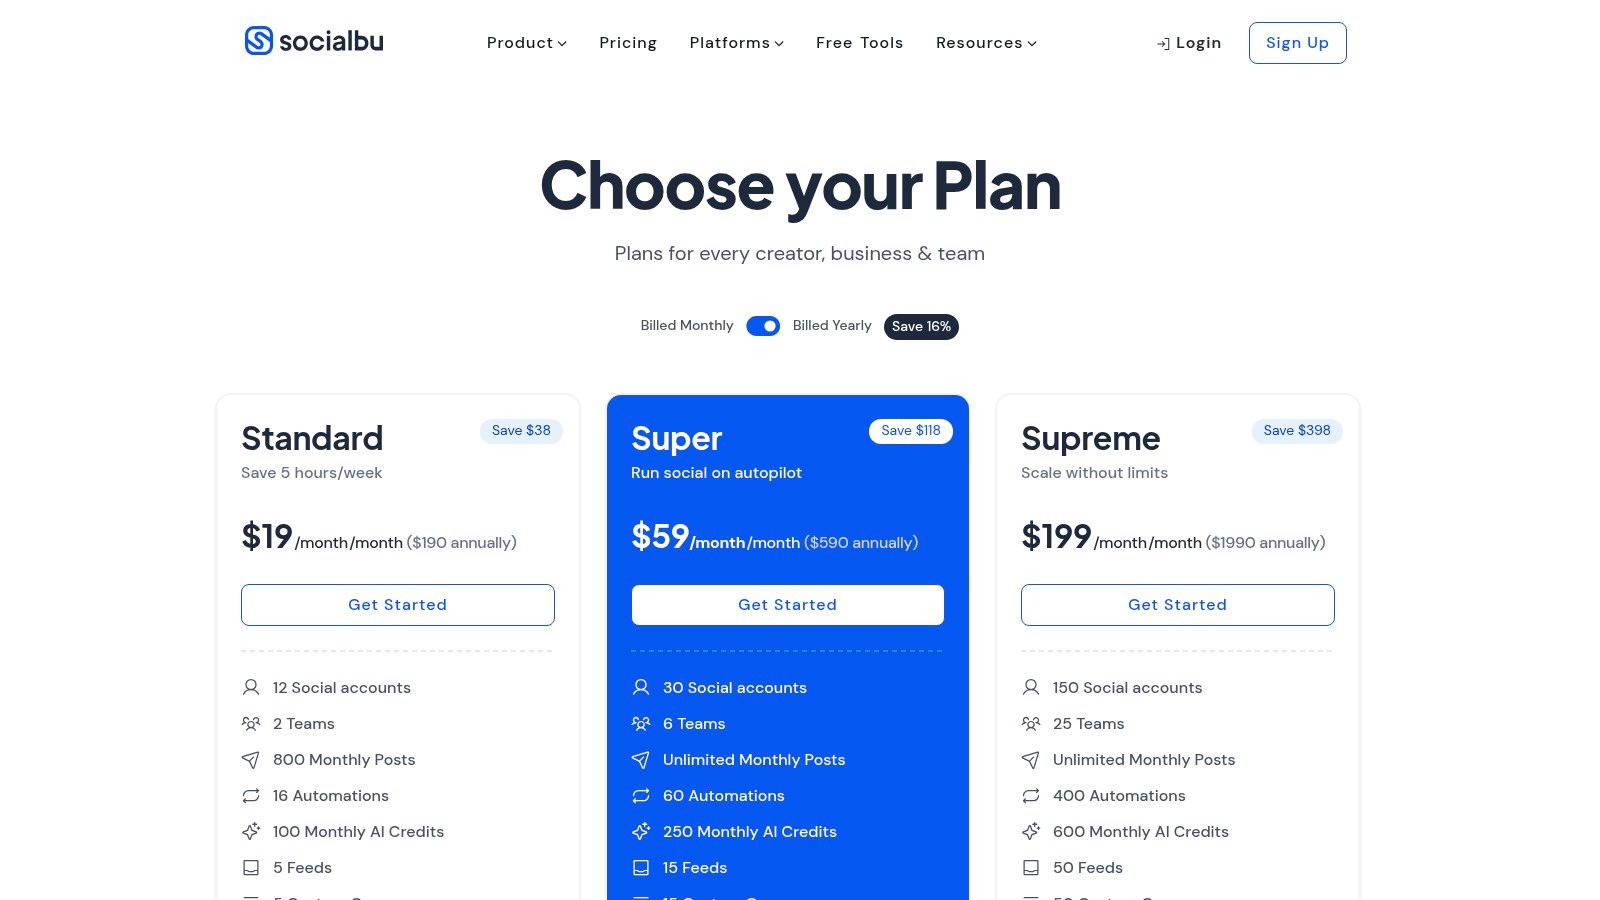
Its free tier gives one user access to two social accounts and a monthly allowance of up to 40 scheduled posts. This model is ideal for maintaining a light but consistent content calendar. While SocialBu automates the publishing process, getting that content noticed requires initial engagement. A service like Upvote.club provides the real likes, comments, and shares needed to boost post visibility. The platform lets members create unlimited tasks to get engagement from verified, human accounts. This initial interaction from genuine users signals to algorithms that your content is good, helping the posts you schedule in SocialBu achieve better organic reach and find a larger audience.
| Feature | Free Plan Limit |
|---|---|
| Users | 1 |
| Connected Channels | 2 |
| Scheduled Posts | Up to 40 per month |
| Key Integrations | Giphy, Unsplash |
| AI Assistant | Not Included |
- Pros: Usable forever-free plan with a monthly post allowance; competitive pricing for paid tiers.
- Cons: Limited platform support on the free plan; some inconsistencies in documentation regarding account limits.
- Link: https://socialbu.com/pricing
9. Agorapulse
Agorapulse is a powerful, enterprise-ready social media suite that offers a useful Free plan, making it one of the more robust free social media management tools available. Known for its unified social inbox and detailed reporting in paid versions, its free offering gives individuals a taste of its professional-grade environment. The platform is ideal for those who anticipate needing to scale up their social media efforts in the future.
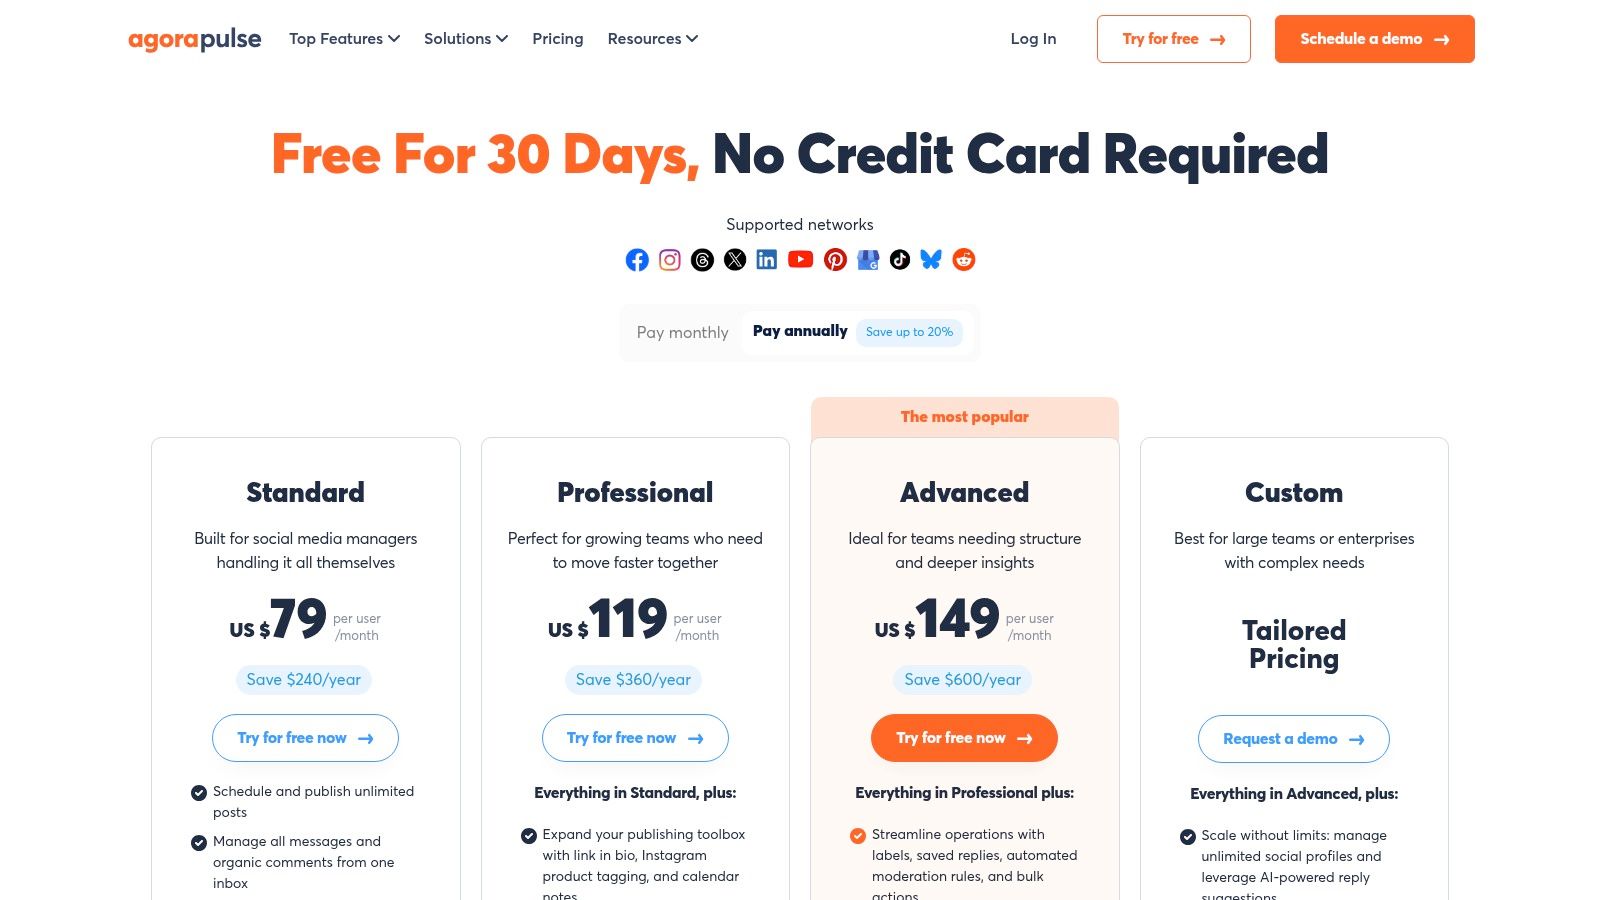
The free plan supports one user and up to three social profiles, with a cap of 10 scheduled posts at any given time. While this limit is tighter than some competitors, it's sufficient for maintaining a basic content calendar. A key feature is the social inbox, which allows you to manage up to 100 items per month, a useful tool for staying on top of audience interactions.
Even with a great management tool, getting initial visibility on platforms like X (formerly Twitter) can be difficult. Complementing Agorapulse with a service like Upvote.club provides the necessary social proof from real users to boost your posts. As a community-driven growth service, it helps users build real engagement without bots across more than 20 platforms. This initial activity helps your content perform better within the algorithm, and you can get free Twitter likes to begin building momentum for the content you've scheduled.
| Feature | Free Plan Limit |
|---|---|
| Users | 1 |
| Connected Channels | Up to 3 |
| Scheduled Posts | 10 total (not per channel) |
| Social Inbox | 100 items per month |
| Mobile App | Included |
- Pros: Reputable platform with a strong unified inbox feature; clear documentation on plan limitations.
- Cons: Very tight scheduling limit (10 posts total); paid plans are expensive.
- Link: https://www.agorapulse.com/pricing
10. Meta Business Suite (Facebook & Instagram)
Meta Business Suite is the official and completely free tool designed for managing Facebook Pages and Instagram professional accounts. As a native platform, it offers direct integration for scheduling, analytics, and community management, making it an essential tool for anyone focused on growing their presence within the Meta ecosystem. The suite consolidates your inbox, content planner, and reports into a single dashboard accessible on both desktop and mobile.
The platform's main advantage is its direct access to the Facebook and Instagram APIs, which reduces the risk of third-party connection errors. You can schedule posts, Stories, and Reels, respond to comments and messages from a unified inbox, and view performance analytics without ever leaving the ecosystem. This makes it one of the most reliable free social media management tools for Meta-specific marketing.
While the Suite handles native scheduling perfectly, achieving visibility requires an initial engagement push. A service like Upvote.club provides the real user interactions that signal to the algorithm your content is good. As a community-driven service for Social Networks, it helps users build real engagement without bots. This initial traction helps your scheduled Facebook posts gain momentum, leading to better organic reach. For more information on this strategy, you can learn more about growing your Facebook presence.
| Feature | Free Plan Limit |
|---|---|
| Users | Unlimited (with different permission levels) |
| Connected Channels | All owned Facebook Pages & Instagram accounts |
| Scheduled Posts | Unlimited |
| Key Integrations | Native to Facebook & Instagram |
| AI Assistant | Not included |
- Pros: Completely free with no limits; direct integration avoids API issues.
- Cons: Users report occasional bugs; scheduling reliability can sometimes be inconsistent.
- Link: https://business.facebook.com
11. Pallyy
Pallyy is a creator-friendly platform with a strong visual focus, making it one of the best free social media management tools for Instagram-centric brands. Its clean interface is built around scheduling and visual planning, offering a dedicated Instagram grid planner and a bio link tool even in its "free forever" plan. This makes it an excellent choice for users who prioritize aesthetics and a streamlined workflow.
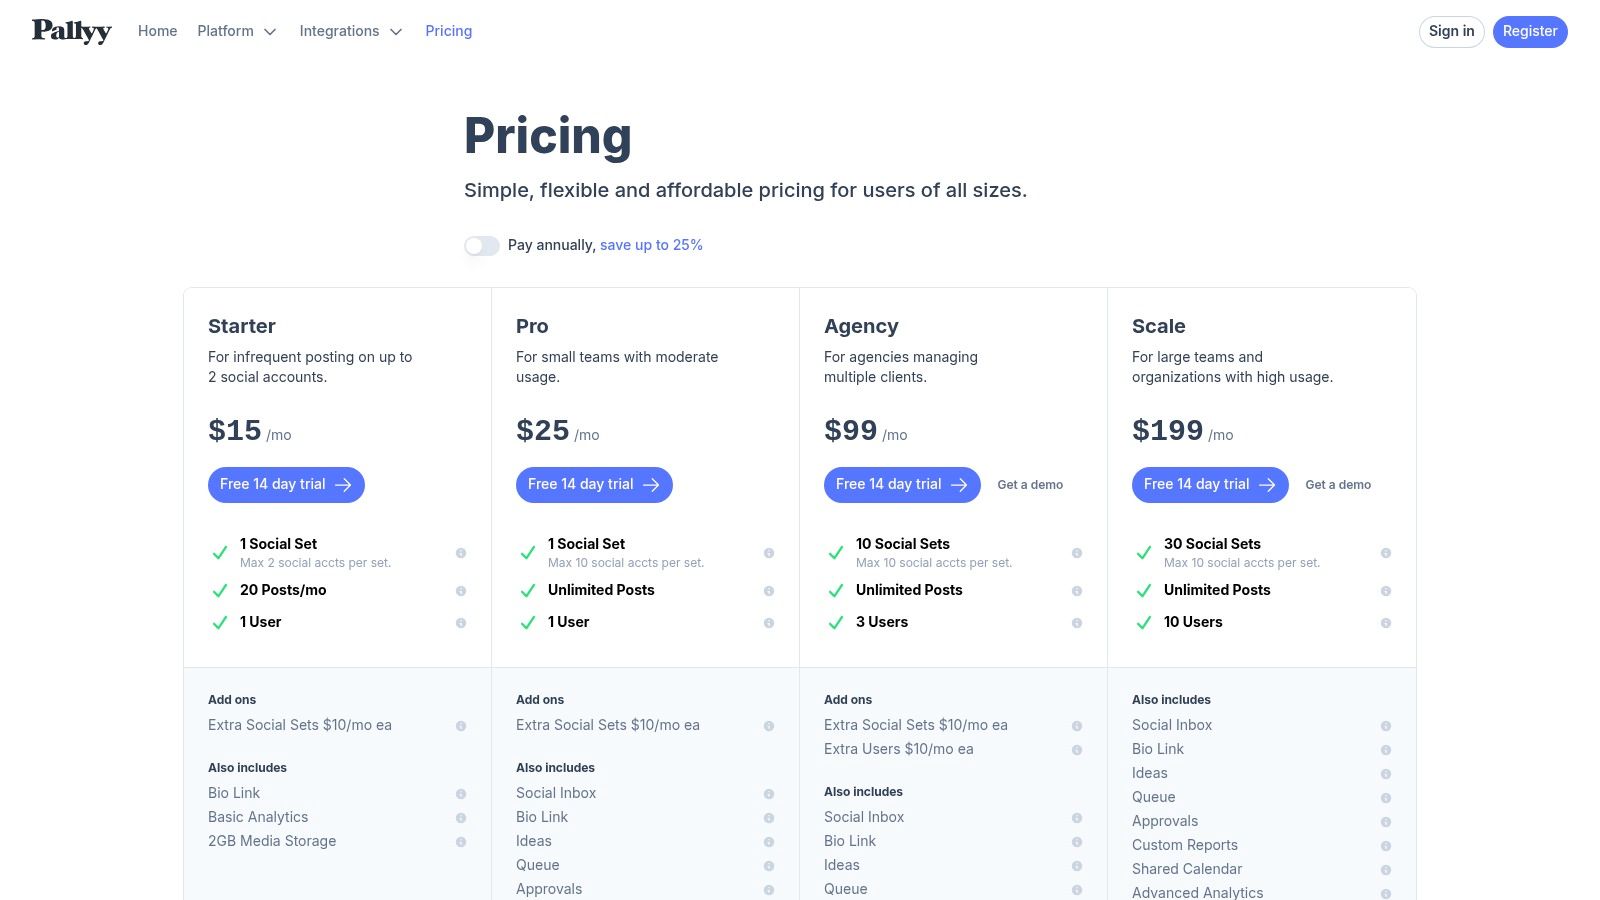
The free plan includes one "Social Set," allowing you to connect one account per platform, and provides a limit of 15 scheduled posts per month. While this posting volume is modest, the inclusion of a bio link tool and grid preview adds good function for individual creators. Pallyy also supports Google Business Profile posting, a unique feature at this level.
Even with a perfectly planned grid, initial post visibility can be a hurdle. This is where a service like Upvote.club becomes a strategic partner. Upvote.club is a community-driven growth service that helps users build real engagement without bots. By securing real likes, comments, and saves from their community of verified users, you can give your Pallyy-scheduled content the early momentum it needs. This authentic interaction signals to algorithms that your post is engaging, helping it reach a broader audience and converting your careful planning into tangible growth.
| Feature | Free Plan Limit |
|---|---|
| Users | 1 |
| Connected Channels | 1 Social Set (1 of each platform) |
| Scheduled Posts | 15 per month (total) |
| Key Integrations | Canva, Unsplash, Google Business Profile |
| AI Assistant | Not Included |
- Pros: Easy UI tailored to creators and Instagram-first workflows; Affordable scaling with social sets and GBP support.
- Cons: Free plan is limited in posting volume; Team features and inbox require paid tiers.
- Link: https://pallyy.com/pricing
12. CoSchedule
CoSchedule is primarily known for its powerful marketing calendar, but its free tier offers a focused and effective social media scheduling tool perfect for solopreneurs and content creators. Its strength lies in its calendar-first approach, allowing you to visualize your entire content plan in one place. The platform excels at helping users organize and plan their social media posts with a clear, strategic overview.
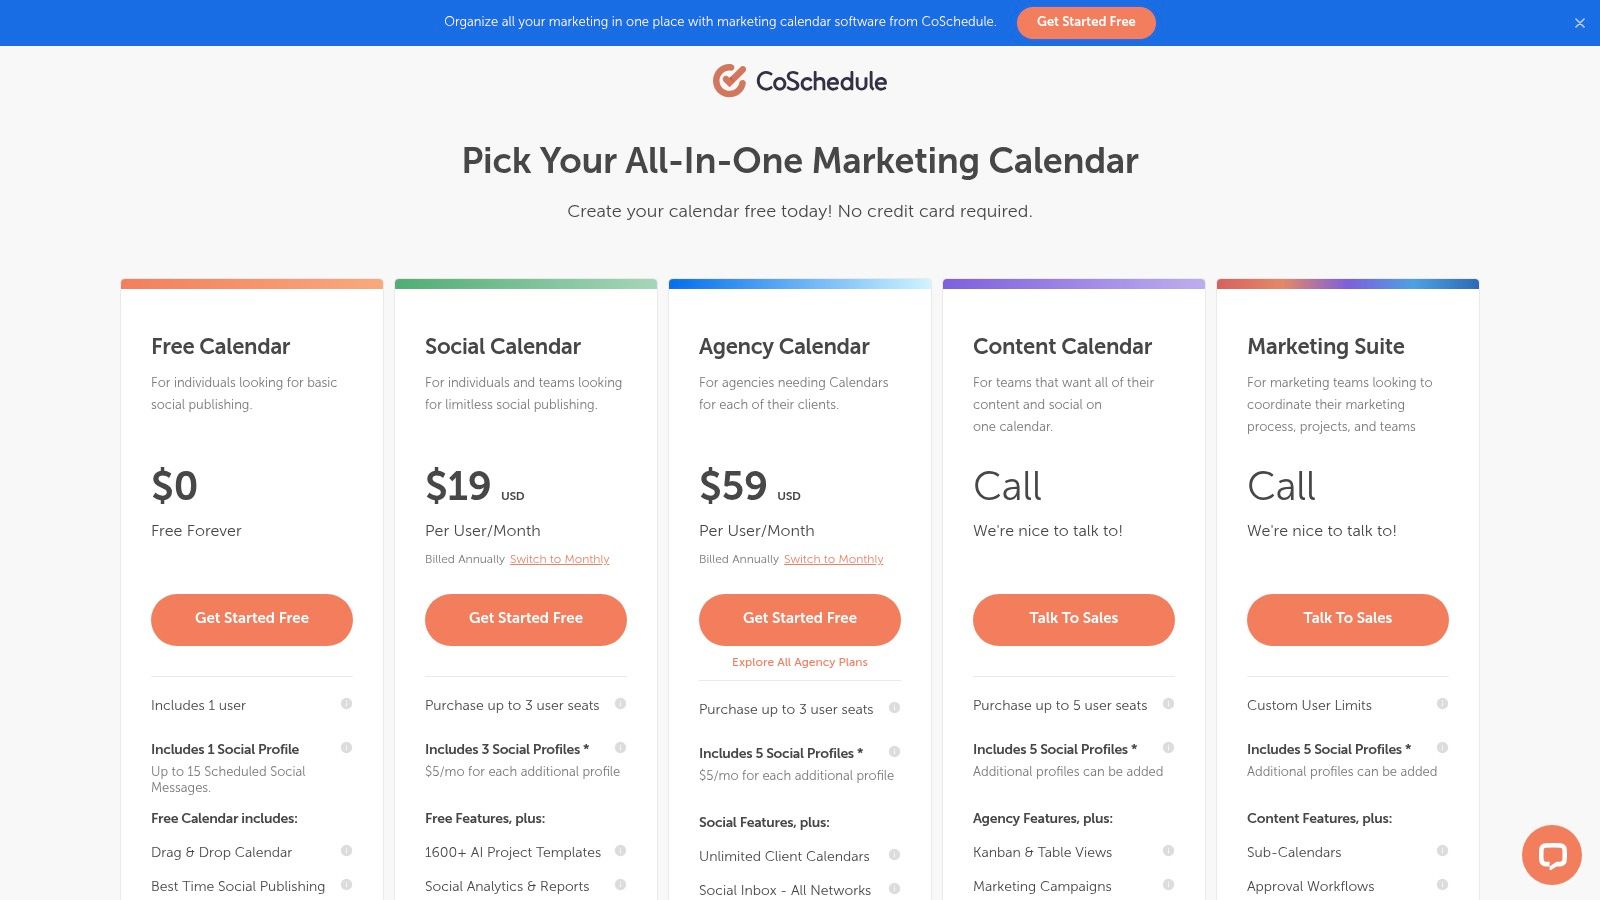
The free plan includes one social profile, which is ideal for concentrating your efforts on a primary channel. You can schedule up to 15 messages in advance and take advantage of its best-time scheduling feature to maximize visibility. This makes it a great entry point into more organized, calendar-driven social media management.
While CoSchedule helps organize your publishing schedule, getting your planned posts seen requires initial interaction. A service like Upvote.club provides the authentic engagement needed to kickstart your content's reach. As a community-driven growth service for Social Networks, Upvote.club helps users build real engagement without bots. By having real users from the community interact with your posts, you signal to algorithms that your content is interesting, which helps it gain momentum and reach a larger audience.
| Feature | Free Plan Limit |
|---|---|
| Users | 1 |
| Connected Channels | 1 |
| Scheduled Posts | 15 total |
| Key Integrations | Unsplash |
| AI Assistant | Included |
- Pros: Mature calendar UI for cross-channel planning; recognized product with steady development.
- Cons: Free plan is single-user and supports only one profile; X/Twitter support is only on paid plans.
- Link: https://coschedule.com/pricing
12 Free Social Media Management Tools — Feature Comparison
| Product | Core offering | Key strengths (USPs) | Target audience | Pricing / Free tier |
|---|---|---|---|---|
| Upvote Club | Community-driven point exchange for verified human likes/comments/follows across 20+ platforms | Real human engagement, strict anti-bot moderation, visible task completions, streaks/invite rewards | Creators, social managers, indie makers, teams needing organic signals | Free entry trial (e.g., 5 free likes); paid accelerators available (costs opaque) |
| Buffer | Scheduling + lightweight analytics and AI assistant | Simple UI, generous free tier, Canva/Unsplash integrations | Individuals and small brands | Free forever: 3 channels, 10 scheduled posts/channel; paid plans per channel |
| Zoho Social | Full social suite with native publishing and basic analytics | Integrates with Zoho ecosystem, truly free forever for one brand | Solo users and Zoho customers | Free forever: 1 brand, 1 user; paid for teams/advanced analytics |
| Publer | Scheduler with built-in editor, Canva, UTM/link shortener | Try many paid features without card, flexible scaling tiers | Small teams and creators testing features | Free: 1 workspace, 3 social accounts (X excluded), 10 scheduled posts/account |
| Metricool | Planning, publishing and analytics with competitor tracking | Strong free analytics and competitor insights | Entry-level analysts, small brands | Free: 1 brand, up to 50 scheduled posts/month; limited analytics history |
| Planoly | Visual-first planner focused on Instagram grid previewing | Clean grid planning UI, free link-in-bio | Creators and visual brands (Instagram-first) | Free: 1 social set, 10 uploads/month; paid for advanced features |
| Vista Social | All-in-one publishing, inbox, listening, reviews and AI | Broad feature set at entry, collaboration & review mgmt, nonprofit discounts | Agencies, teams, businesses needing reviews/listening | Free version for essentials; paid tiers with trials |
| SocialBu | Scheduler with automations and multi-network support | Usable forever-free plan, competitive scaling pricing | Budget-conscious creators and small teams | Free: ~2 accounts, up to 40 posts/month; paid for more features |
| Agorapulse | Unified inbox, scheduling and robust reporting | Strong paid reporting, reputable vendor, clear limits | Agencies and enterprises needing inbox/reporting | Free: 3 profiles, 1 user, 10 scheduled posts total; paid tiers higher-priced |
| Meta Business Suite | Native management for Facebook Pages & Instagram | Completely free, native integration reduces API issues | Businesses on Facebook & Instagram | Free (native scheduling, unified inbox, reports) |
| Pallyy | Creator-focused scheduler with grid planner and bio link | Easy UI for creators, generous starter plan | Instagram creators and small teams | Free: 1 social set, 15 scheduled posts/month; paid for teams/inbox |
| CoSchedule | Marketing calendar with basic social publishing | Mature drag-and-drop calendar, best-time scheduling | Marketers and teams organizing campaigns | Free Calendar: 1 user, 1 social profile, up to 15 scheduled messages |
Choosing the Right Free Tool for Your Needs
Navigating the world of free social media management tools can feel overwhelming, but the right platform can dramatically streamline your workflow and expand your digital footprint. As we've detailed, each tool offers a distinct set of features and limitations. Your ideal choice depends on your specific goals, the platforms you prioritize, and the scale of your operation.
The key is to move beyond a simple feature checklist and consider your practical, day-to-day needs. A solo content creator might find Buffer's straightforward scheduling and clean interface perfect for maintaining consistency. A small business focused on customer interaction could benefit from Zoho Social's built-in monitoring and team collaboration features. For those managing multiple brands or needing broad platform support on a budget, Publer presents a compelling option with its generous free tier.
Making Your Final Decision
When selecting a tool, focus on these critical factors:
- Platform Support: Does the tool connect to all your essential social networks? If LinkedIn is a primary channel for you, for example, comparing the capabilities of different tools becomes necessary. While considering various platforms, you might find it helpful to review comparisons of the best LinkedIn schedulers on the market to see how specialized tools perform.
- Core Functionality: Identify your main bottleneck. Is it scheduling posts, analyzing performance, or engaging with your audience? Choose a tool whose free plan excels in that specific area. Metricool, for instance, shines with its unified analytics dashboard.
- Usage Limits: Pay close attention to the free tier's restrictions. A limit of three social profiles might be sufficient for a personal brand but too restrictive for a growing agency. Always check the number of users, scheduled posts per month, and any limitations on advanced features.
- Growth Potential: Consider what happens when you outgrow the free plan. Does the platform offer affordable paid tiers that align with your future budget and operational needs? A tool with a clear and reasonable upgrade path provides long-term stability.
Ultimately, the best approach is hands-on experimentation. Sign up for the two or three tools that seem most aligned with your strategy and use them for a week. This trial period will give you a genuine feel for the user interface, workflow efficiency, and how well each platform integrates into your content creation process.
Remember, a management tool automates posting and provides data, but it can't create engagement on its own. That's where authentic interaction comes into play. By combining a reliable scheduler with a community-driven growth service like Upvote.club, you create a powerful system. Upvote.club is a community-driven growth service for Social Networks that helps users build real engagement without bots by rewarding them for interacting with other members' content. You can plan and distribute your content efficiently while making sure it receives the initial, human-powered signals that algorithms favor for wider reach. This dual approach helps you maintain consistency and build real momentum.
Ready to complement your scheduling efforts with real, organic engagement? Join the Upvote Club to connect with a community of creators and professionals. Start receiving authentic likes, comments, and shares from verified users to give your content the initial push it needs to trend. Sign up for free and start growing today.
More articles
alexeympw
Published November 5, 2025