
Before you can measure a single like, share, or comment, you have to answer a simple question: what are you actually trying to achieve?
Many fall into the trap of tracking vanity metrics without connecting them back to real business outcomes. The goal is not just to be busy on social media; it is to drive results.
Matching Your Metrics to Your Mission
Trying to measure social engagement without clear goals is like driving without a destination. The numbers only matter if they tell you whether your strategy is working. Every metric you track has to tie back to a specific business objective.
Forget generic targets like "get more followers." Instead, define what success looks like in concrete terms. Are you trying to build brand awareness? Drive traffic to your new product page? Generate qualified leads for your sales team? Each of these goals demands a different set of metrics.
From Big Goals to Specific KPIs
Thinking about this like a classic marketing funnel is helpful. Breaking your objectives down into stages makes it easier to see what you should be measuring and why.
- Awareness: This is all about getting your brand in front of new eyeballs. Your metrics here should be all about visibility and reach.
- Consideration: At this point, you are building relationships and getting people to interact with you. The numbers need to show active participation.
- Conversion: This is the action stage. You are asking your audience to take a specific action, like signing up for a newsletter or buying something. The metrics have to track these bottom-line results.
Thinking this way turns measurement from a chore into an active tool for making smarter moves. It is also worth looking at what is working for others in cutting-edge spaces; for instance, many of the same principles apply to successful Web3 community building strategies.
The whole process boils down to this simple flow: define your goal, match it to the right metric, and then analyze the data.
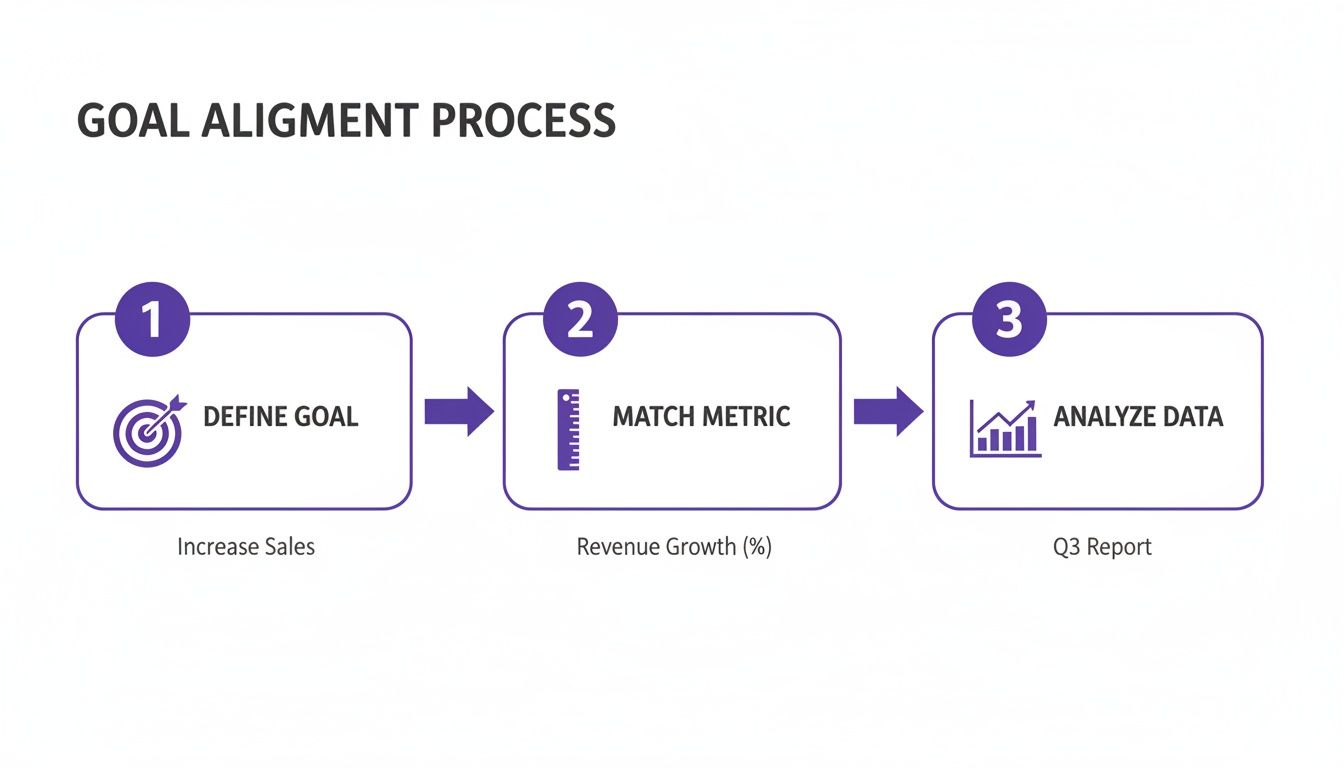
This visual is a great reminder that you cannot get to the analysis part until you have nailed down your objectives and picked the right KPIs to watch.
Real-World Goals and the Metrics That Matter
Let's make this practical. If your primary goal is Brand Awareness, you would focus on metrics like:
- Reach: How many unique accounts saw your post?
- Impressions: What was the total number of times your content was displayed?
- Follower Growth Rate: How quickly is your audience expanding?
But if your goal is driving website traffic, your focus shifts. You would be tracking:
- Click-Through Rate (CTR): What percentage of people who saw your post clicked the link?
- Website Referral Traffic: How many visitors are coming to your site directly from your social channels? (Check your Google Analytics for this!)
The core principle is simple: If a metric does not help you understand your progress toward a specific business goal, it is a distraction. Focus your energy on the data that provides a clear path forward.
For new creators, getting that initial burst of interaction is important, especially on a platform like Instagram where the algorithm is king. Our Upvote.club service is a community-driven growth service for Social Networks that helps users build real engagement without bots. With our Upvote.club service, you can get that early engagement from real people, which signals to the algorithm that your content is worth showing to a wider audience. The platform lets our members create unlimited tasks to receive likes, comments, reposts, saves, and followers from verified, human accounts.
Alright, once your goals are locked in, it is time to get our hands dirty with the numbers. If you want to measure social media engagement, you need the right formulas. Without them, you are just staring at a pile of likes, shares, and comments with zero context. These calculations are what turn all that raw data into something you can use to compare performance.
The way we look at engagement has changed. A decade ago, everyone was obsessed with follower counts, but that is an old approach now. We know that rate-based metrics give you a clearer, more honest picture of what is working.
Think about it: back in 2010, brands were mostly just tracking raw likes and followers. By 2018, smart marketers had shifted to engagement rates. Studies were coming out showing that vanity metrics were misleading. A post with 1,000 likes on an account with 1 million followers (0.1% ER) is a different story than 1,000 likes on an account with 10,000 followers (10% ER). This realization is why agencies everywhere adopted engagement rate formulas.
Two of the most reliable formulas you will use are Engagement Rate by Reach (ERR) and Engagement Rate by Post (ER Post). Each one tells a slightly different story about how your content is landing.
Engagement Rate by Reach (ERR)
This formula is my go-to for judging the true quality of a piece of content. It shows you the percentage of people who saw your post and decided it was worth interacting with.
The Formula: (Total Engagements on a Post / Total Reach of the Post) x 100
Pull out the ERR formula when you need to know how compelling your content is. It cuts through the noise of inactive followers and focuses purely on the post's effectiveness with the audience it reached.
Engagement Rate by Post (ER Post)
This one calculates your engagement rate relative to your total follower count. It is a solid way to track the general pulse of your community over time.
The Formula: (Total Engagements on a Post / Total Followers) x 100
Use ER Post when you want a consistent benchmark for the overall health and responsiveness of your follower base. Just be warned: its accuracy can get a bit fuzzy due to inactive followers or algorithm changes that limit who sees your post in the first place.
Which formula should you use? It comes down to your objective. Use ERR to judge content quality and ER Post to monitor your community's general vibe. Most of us track both to get the full picture.
Platform-Specific Calculations
So, how do you apply these formulas in the real world? It changes a bit depending on the platform and what counts as an "engagement." Let's break it down for the big players.
Here is a quick-reference table to show you the most common formulas for calculating engagement rates on the top social media networks. Keep this handy!
Engagement Rate Formulas by Social Media Platform
| Platform | Engagement Rate by Reach (ERR) | Engagement Rate by Post (ER Post) |
|---|---|---|
| (Likes + Comments + Saves) / Reach x 100 | (Likes + Comments + Saves) / Followers x 100 | |
| X/Twitter | (Likes + Replies + Reposts) / Impressions x 100 | (Likes + Replies + Reposts) / Followers x 100 |
| TikTok | (Likes + Comments + Shares) / Views x 100 | (Likes + Comments + Shares) / Followers x 100 |
| (Reactions + Comments + Shares) / Views x 100 | (Reactions + Comments + Shares) / Followers x 100 | |
| YouTube | (Likes + Comments + Shares) / Views x 100 | (Likes + Comments + Shares) / Subscribers x 100 |
This table should give you a solid starting point for crunching your own numbers. Let's walk through some real examples for each platform.
Instagram Engagement Formulas
On Instagram, we typically count likes, comments, saves, and shares as engagements.
-
ERR Example: Let's say your Reel reaches 5,000 people. It gets 400 likes, 50 comments, and 50 saves.
- Total Engagements = 400 + 50 + 50 = 500
- ERR = (500 / 5,000) x 100 = 10%
-
ER Post Example: You have 10,000 followers, and that same post got 500 engagements.
- ER Post = (500 / 10,000) x 100 = 5%
X/Twitter Engagement Formulas
For X (the platform formerly known as Twitter), your key engagements are likes, replies, and reposts.
-
ERR Example: Your post reaches 20,000 people and gets 800 likes, 100 replies, and 100 reposts.
- Total Engagements = 800 + 100 + 100 = 1,000
- ERR = (1,000 / 20,000) x 100 = 5%
-
ER Post Example: If you have 15,000 followers, that post's ER Post is:
- ER Post = (1,000 / 15,000) x 100 = 6.67%
Getting traction on X can feel like a real grind, which is where a community-first approach can move the needle. With our Upvote.club service, you can get those early interactions that tell the algorithm your post is worth showing. Our platform operates on a community-based model where users help each other grow. You complete tasks for others to earn points, then use those points to create your own tasks—for instance, you can get Twitter likes from real users in the community. It is a way to build momentum without ever giving out your password.
TikTok Engagement Formulas
On TikTok, you are looking at likes, comments, shares, and saves.
-
ERR Example: Your video gets 100,000 views (which TikTok treats as reach) and racks up 8,000 likes, 500 comments, 1,000 shares, and 500 saves.
- Total Engagements = 8,000 + 500 + 1,000 + 500 = 10,000
- ERR = (10,000 / 100,000) x 100 = 10%
-
ER Post Example: And if you have 50,000 followers, the ER Post looks like this:
- ER Post = (10,000 / 50,000) x 100 = 20%
LinkedIn Engagement Formulas
For LinkedIn, engagements are your reactions (like, celebrate, support, etc.), comments, and shares.
-
ERR Example: Your article reaches 2,500 people. It gets 150 reactions, 40 comments, and 10 shares.
- Total Engagements = 150 + 40 + 10 = 200
- ERR = (200 / 2,500) x 100 = 8%
-
ER Post Example: If your profile has 5,000 followers, the math is simple:
- ER Post = (200 / 5,000) x 100 = 4%
By sticking to these standard formulas, you can compare your performance accurately across different platforms and content formats. This is the kind of data that lets you stop guessing and start making smarter decisions with your strategy.
Setting Benchmarks That Make Sense
Okay, so you have crunched the numbers and have your engagement rates. But what does a 4% engagement rate actually mean? Is that good? Bad? Just… average? Without context, that number is just a lonely piece of data, not a story about your performance.
This is where benchmarking comes in. It is the process of comparing your performance against a standard, turning raw figures into a clear narrative of what is working and what is not. To get the full picture, you need to look at it from two different angles.

Looking Inward with Historical Benchmarking
The first, and most useful, place to start is with your own past performance. It is as simple as it sounds: compare your current metrics to what you were pulling last week, last month, or last quarter.
This is my go-to method for tracking genuine progress. Are your engagement rates trending up? Did that new video series cause a spike in comments? Looking at your own history gives you a baseline that is tailored to your account and your audience. It is the only real way to know if the strategic changes you are making are moving the needle.
Sizing Up the Competition
While looking at your own data is important for tracking progress, competitive benchmarking tells you where you fit in the grand scheme of things. This means comparing your engagement rates to your direct competitors or even broader industry averages. This external view is essential for setting goals that are grounded in reality.
But there is a catch here: you must compare apples to apples. Follower count has a dramatic effect on engagement rates. Data from across billions of social media users consistently shows that smaller accounts have higher engagement rates.
It is pointless to compare a 10k follower account to a household name with millions. An account under 100,000 followers might see an average engagement rate of 2-5%, while mega-brands are often thrilled to get below 0.5%. Always compare like-for-like.
Finding and Using Industry Data
So, where do you get your hands on this competitive data? It is more accessible than you might think.
- Do Some Manual Recon: Pick five to ten of your closest competitors and do a little digging. Manually calculate the engagement rates for their last ten posts to get a rough average. Yes, it is a bit of a grind, but it gives you a relevant snapshot of your immediate surroundings.
- Hunt Down Industry Reports: Marketing analytics companies like Rival IQ or Socialinsider often publish annual reports. A quick search for something like "[Your Industry] social media benchmarks 2024" usually turns up good information.
- Use Analytics Tools: If you have the budget, paid tools can be a lifesaver. They often have features that automatically track and report on competitor performance, saving you hours of manual work.
Once you have these numbers, you can set a target that makes sense. For example, if your historical average is 2% and your competitors are pulling 3.5%, setting a goal to hit 3% next quarter is ambitious but achievable.
This process turns measurement from a boring reporting task into a tool for growth. It also shows how important it is to get that initial burst of engagement right after you post. At Upvote.club, we built our service to help you nail those benchmarks. By joining our community, you can get real likes, comments, and shares from verified users, giving your content the initial push it needs to perform better against your own history and stand out from the competition.
Turning Your Numbers Into a Story: How to Build a Simple Reporting Dashboard
Once you have your metrics nailed down and a few benchmarks in place, it is time to bring them to life. Consistent tracking is what separates a few lucky viral posts from real, sustained growth. A simple reporting dashboard stops you from drowning in data and starts telling a visual story, making it simple to spot trends and make smart calls on the fly.
You do not need fancy, expensive software to get started. You can build a great dashboard with free tools you probably already use.
- Google Sheets: This is your workhorse. It is perfect for creating clean tables and charts to track your KPIs over time. Do not underestimate its power.
- Looker Studio (formerly Google Data Studio): This is where you make it pretty. Looker is a free tool that pulls data from sources like Google Analytics and your Sheets to create interactive, easy-to-share reports that look good.
The point is to graduate from a messy spreadsheet filled with random numbers. A good dashboard gives you a clear, at-a-glance picture of your social media health, so you know what is going on without getting lost in the weeds.
What Should Go In Your Dashboard?
A great dashboard works on multiple levels, giving you the 30,000-foot view and the ground-level details all in one place. I always structure my reports with a few key sections to keep things organized.
First up, you need a High-Level Summary. Think of this as the executive summary for busy team members or clients. It should feature the most important numbers for whatever period you are reporting on:
- Total Follower Growth
- Overall Engagement Rate (I usually use ERR here for a stable view)
- Total Reach or Impressions
- Website Clicks from social
Next, you need a Platform-Specific Breakdown. This is where you see which channels are pulling their weight. You might discover your Instagram engagement is on fire while your X/Twitter game is falling flat. This view is important for figuring out where to double down on your efforts.
Finally, my favorite part: a Top-Performing Posts section. List your top 3-5 posts from the period, ranked by engagement rate. I like to include a small thumbnail of the post right next to its key stats (likes, comments, shares, reach). This instantly shows everyone what is connecting with your audience and sparks ideas for future content.
Setting a Rhythm for Your Reporting
How often should you pull these reports? It depends on your goals and how much time you have, but the key is to get into a consistent rhythm. A tiered schedule is what I have found works best for most teams.
Weekly check-ins are quick hits. You are just looking at top-performing content and any weird spikes or dips. Monthly reports are for a deeper dive into trends, and quarterly reviews are where you zoom out to make bigger strategic decisions.
To make populating your dashboard less of a chore, you should look into the best tools for social media analytics. Many of these can automate the data collection, which is a massive time-saver.
At Upvote.club, we designed our own platform to make this process as transparent as possible. When you create tasks to get likes or comments, for example, you can see exactly which community members completed them—total accountability. We even built a browser extension to make completing those tasks smoother for everyone involved. You can download and learn more about our Chrome extension for social media tasks here. This gives you a direct line of sight into the engagement you are building, which you can then feed right back into your dashboard.
The "Golden Hour" Problem: Getting Your First Wave of Engagement
You can have the most sophisticated dashboard in the world, but it is useless without data. And to get data, you need engagement. The real difficulty is getting that first burst of interaction right after you hit "publish."
Platform algorithms are tough. They use the first hour of a post's life—the "Golden Hour"—as a signal. If a post gets early likes, comments, and shares, the algorithm assumes it is interesting and shows it to more people. If it does not? It dies.
This is where a community-powered approach can make all the difference. With our service, Upvote.club, we have built a way for creators to help each other overcome that initial hurdle with real, human engagement. Upvote.club works differently from other services. While other platforms let you buy likes, Upvote.club is not about buying engagement — it is about participating in a community. This system gives the algorithm the positive signals it is looking for, which can boost your organic reach.

How a Community-Powered System Works
We built Upvote.club because we were tired of seeing services that sold fake engagement. This is not about buying bots; it is about participating in a community of people who all want to grow.
Here is how our service works: When a user registers, they receive 13 free points and 2 task slots. These can be used to create the first task. For example, getting 2 likes on Twitter might cost 4 points. If more points are needed, the user must complete tasks for others. This reciprocal system ensures every interaction is genuine and comes from an active user. We are strict about moderation, and bot accounts are not allowed. By helping others, you earn the ability to promote your own content.
Getting Started is Simple (and Safe)
We designed the process to be straightforward and, most importantly, secure.
- Jump Right In: As soon as you register, your points and task slots are waiting. You can create a task for your content in minutes.
- Secure Verification: The first time you complete a task, we will ask you to verify your social media account. We have added a unique, emoji-based verification system to our Upvote.club service that never asks for your password. Your account's security is never compromised.
- Earn and Grow: Keep completing tasks to rack up more points. You also get a free task slot every 24 hours, which means you can get a daily boost without spending a dime.
For those who want to move faster, we do offer subscription plans that load your account with points and extra task slots right away.
Here is why it works: There are only two real ways to grow on social media: consistently post high-quality content and get engagement. Getting engagement within the first hour after posting is what matters most — this is known as the Golden Hour. Influencer agencies use this exact strategy to boost their clients’ content. Now, with our Upvote.club service, we make this method accessible to everyday users who want more reach on social media.
Thinking about engagement in this strategic way is becoming more common as the industry matures. It is no surprise that global social media ad spend was projected to hit $276–$277 billion by 2025. That kind of investment means marketers are moving beyond simple vanity metrics and tracking a combination of KPIs like interactions, reach, and conversions to prove their ROI.
When you understand these dynamics, you can see why getting authentic early interaction is so important. For example, if you are trying to gain traction on newer platforms like Threads, that initial feedback loop is everything. Our guide on getting more engagement on your Threads account actually pairs perfectly with this strategy.
Here is a quick look at why a community-based approach is fundamentally different from services that just sell you fake engagement.
Upvote.club vs. Traditional Engagement Services
| Feature | Upvote.club | Other Services |
|---|---|---|
| Engagement Source | 100% real, active users from a community | Often bot accounts or low-quality profiles |
| Growth Model | Earn-and-spend system promotes reciprocity | Pay-per-like/follower, transactional model |
| Account Safety | No password required, emoji-based verification | Frequently require account login details, high risk |
| Algorithm Impact | Authentic activity signals good content to algorithms | Bot activity can get your account flagged or banned |
| Cost | Free to start and earn; optional paid plans | Purely paid service, can become expensive |
Ultimately, a community model gives your content a fighting chance. By securing real, early interactions, you are not just gaming an algorithm—you are generating the data you need to measure and refine your entire social media strategy.
Got Questions About Measuring Engagement?
As you start digging into the numbers, a few common questions always seem to pop up. Let's tackle them head-on, because getting these fundamentals right will make everything else click into place.
"So, What’s a Good Engagement Rate, Anyway?"
This is the million-dollar question, is it not? The honest answer is: there is no magic number. A "good" rate is all about context.
A good engagement rate depends on the platform, your industry, and how big your audience is. For example, the average on Instagram might be somewhere around 0.50%, but a network like LinkedIn could see averages closer to 6% because the user intent is so different.
Here is a tip from experience: smaller accounts (think under 10,000 followers) almost always have higher engagement rates than huge brands. So stop chasing some universal benchmark. The best thing you can do is measure your performance against your own past results and your direct competitors who have a similar follower count.
"Should I Use Engagement Rate by Reach or by Followers?"
For your day-to-day analysis of what content is actually working, Engagement Rate by Reach (ERR) is your best friend.
Why? Because ERR tells you the percentage of people who interacted after they saw your post. It cuts through the noise of inactive followers or algorithm quirks and gives you a pure signal on your content's quality.
Engagement Rate by Followers can be misleading. A huge chunk of your followers might be dormant accounts, or they just were not online when the algorithm decided to show your post. If you want to know how compelling your content is to the people it connects with, stick with reach.
"How Often Should I Be Reporting on This Stuff?"
The right reporting rhythm boils down to your goals and the speed of your campaigns. The key is to have a consistent cadence.
I have found this simple structure works wonders:
- A quick weekly check-in: This is perfect for a gut check. You can spot any posts that are taking off or completely flopping and make quick adjustments. It is about catching immediate trends.
- A deeper monthly report: This is where you zoom out a bit. You will analyze broader patterns and see if you are making progress toward your main objectives for the month.
- A strategic quarterly review: This is the big picture. Use this long-term data to make the important calls—like shifting your budget, ditching content pillars that are not working, or doubling down on what your audience loves.
At Upvote.club, we know that the toughest part is getting those first few interactions to even start collecting this data. With our Upvote.club service, you can join a community of real users who help each other get that early engagement. See how our community can help kickstart your growth.
More articles
alexeympw
Published December 21, 2025