Table of Contents
- Table of Contents
- What Is Twitter Engagement?
- Why Your Twitter Engagement Rate Matters
- Reach is cheap. Response is harder.
- What this metric reveals about your content
- Why engagement rate matters for growth
- How to Calculate Your Twitter Engagement Rate
- The official formula
- What counts in each part
- A simple example without bad math
- How to see your engagement rate in X Analytics
- What Is a Good Twitter Engagement Rate in 2026
- The benchmark that resets expectations
- A practical way to read your number
- Why one benchmark never tells the full story
- Common Measurement Pitfalls to Avoid
- Impressions can hide weak response
- Three mistakes that distort your read
- Follower count is a weak excuse
- Data-Backed Tactics for Higher Engagement
- Text posts can still win
- Timing is now about audience overlap
- What tends to work better than polished branding
- The Golden Hour and Community-Driven Growth
- Early engagement changes who gets the post
- A community model works differently from fake engagement
- When community-driven support makes sense
- Tracking Your Progress and Adjusting Your Strategy
- Build a repeatable review habit
- Watch the audience signal, not just the score
You post something sharp on X. It's timely, clear, and relevant to your audience. Then nothing happens. A few impressions show up, maybe one like, maybe a reply from an account that looks half-abandoned. That pattern frustrates a lot of smart people because the problem usually isn't effort. It's measurement.
Most accounts don't need more posting. They need a better read on Twitter engagement rate—the share of impressions that earn a response—and a system for improving it. Once you know how X counts engagement, what a realistic benchmark looks like, and what formats tend to start replies and reposts, your account stops feeling random.
Table of Contents
- What Is Twitter Engagement?
- Why Your Twitter Engagement Rate Matters
- How to Calculate Your Twitter Engagement Rate
- What Is a Good Twitter Engagement Rate in 2026
- Common Measurement Pitfalls to Avoid
- Data-Backed Tactics for Higher Engagement
- The Golden Hour and Community-Driven Growth
- Tracking Your Progress and Adjusting Your Strategy
What Is Twitter Engagement?
Twitter engagement is any counted action someone takes on a post after seeing it. On X, that typically includes likes, replies, reposts, bookmarks/saves, link clicks, profile clicks, and other tracked interactions. Engagement is the response side of the equation; impressions are the exposure side.
Twitter engagement rate turns that into a percentage: how often people who saw the post actually responded. One engagement equals one counted action in X Analytics, so the rate measures response density per impression—not how many followers you have.
Why Your Twitter Engagement Rate Matters
You post something you're sure will work. The topic is strong, the timing feels right, and impressions start climbing. An hour later, the post has reach but barely any replies, reposts, profile clicks, or link clicks. That is the moment engagement rate stops being a vanity metric and becomes a diagnostic one.
On X, distribution and response are not the same thing. A post can get shown widely and still fail to create any useful action. Engagement rate shows whether your content earned attention strongly enough for someone to do something with it.

Reach is cheap. Response is harder.
According to Sprout Social's X statistics roundup, the average engagement rate per post from an X influencer in 2025 was 0.39%, while Instagram was 3.5% and LinkedIn was 3.4%. The same source notes X ad reach at 586 million users in early 2025.
That gap matters in practice. X can still put a post in front of a large audience, but the audience reacts less often than people do on several other platforms. So weak execution gets exposed fast. A soft hook, a vague opinion, or a post that asks for nothing usually shows up as impressions without meaningful action.
I use engagement rate as an early filter for content quality because it reveals problems reach can hide.
What this metric reveals about your content
Low engagement on high impressions usually reveals one of four problems: the opening did not create enough interest, the format did not fit X, the post reached a cold audience, or the first hour produced too little interaction. Use the breakdown below to identify which signal is holding the post back.
- The opening line did not create enough curiosity or tension.
- The post format worked against the platform. Native opinion posts and reply-driven posts often outperform posts that feel like outbound traffic pushes.
- The audience was too cold. The platform showed the post, but not to people ready to react.
- The first hour was flat. On X, early interaction often shapes whether a post keeps circulating or fades.
That last point gets ignored too often. The first wave of real engagement matters because X responds to momentum. If a post gets credible interaction early, it has a better chance of reaching beyond your existing followers. That is why experienced operators pay attention to the Golden Hour and why some use a community-based Twitter engagement workflow to help seed legitimate early activity from real community members.
Why engagement rate matters for growth
A stronger engagement rate usually leads to better second-order outcomes. More profile visits. More follows from the right audience. More replies that extend the post's lifespan. Better signal on what your audience wants from you.
It also helps you make better decisions. If one post gets average reach but strong engagement, that format is often worth repeating. If another gets impressive impressions and weak interaction, the platform gave you a test and the market said no.
That is the primary value of tracking Twitter engagement rate. It helps separate visibility from resonance, and on X, resonance is what compounds.
How to Calculate Your Twitter Engagement Rate
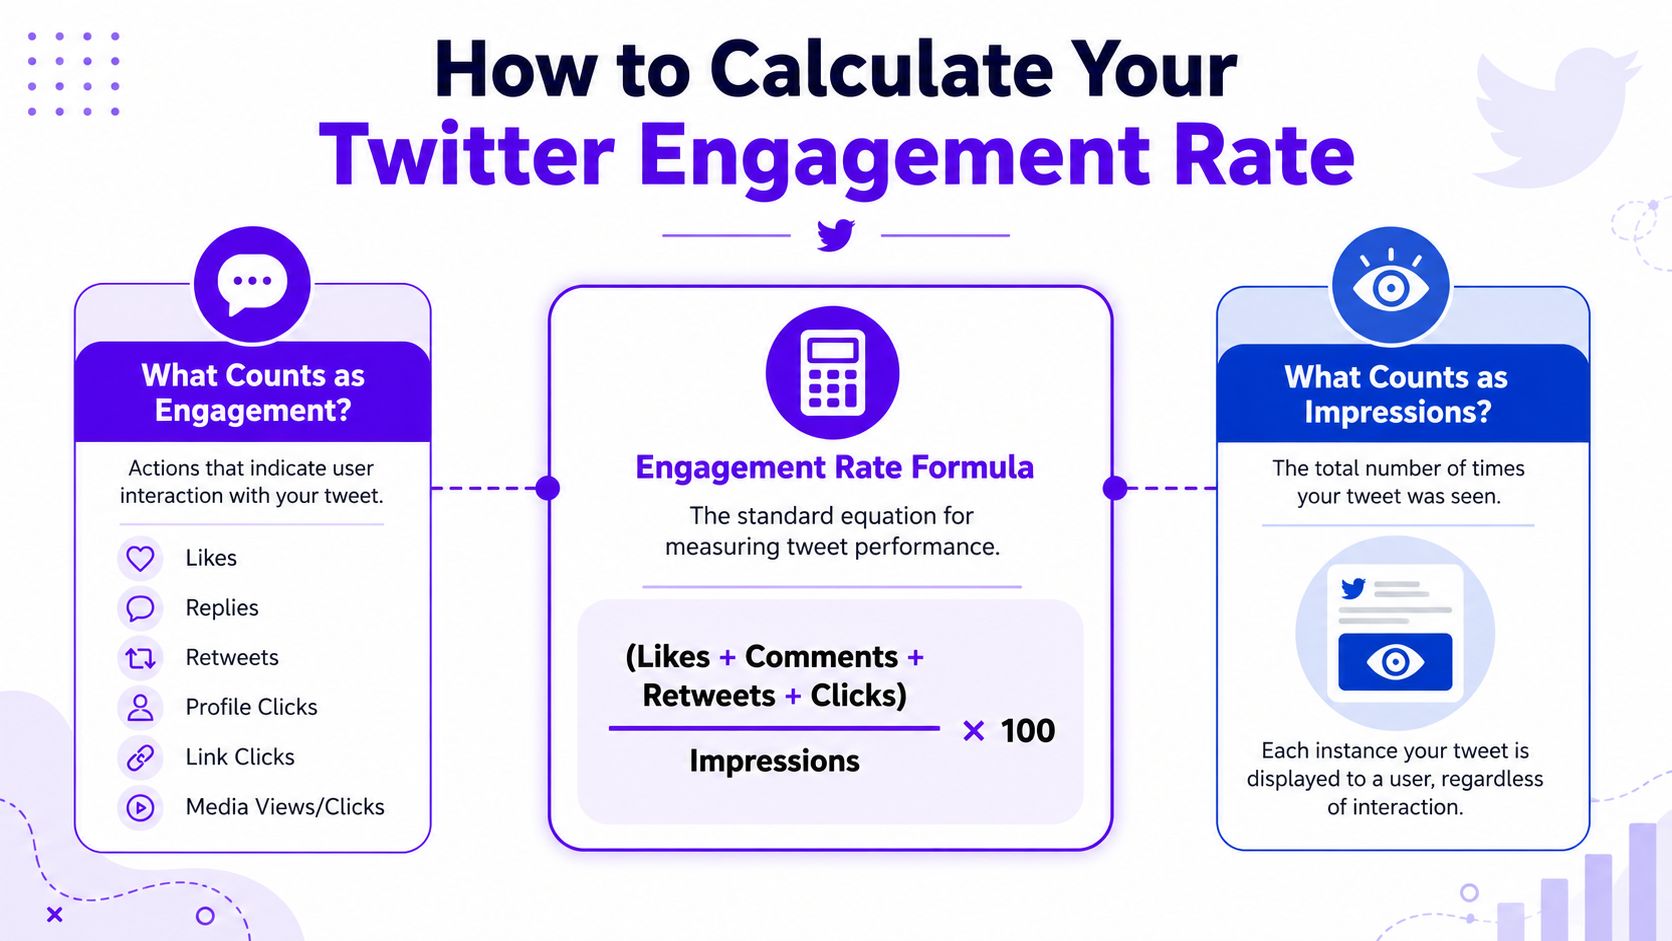
Calculate your Twitter engagement rate with (total engagements ÷ total impressions) × 100. Use impressions—not follower count—as the denominator, and include every engagement action reported by X Analytics.
Apply the same definition to every post and date range. That keeps comparisons consistent and prevents changes in counting method from looking like changes in performance.
The official formula
According to X Developers' explanation of engagement rate, the formula is (engagements / impressions) × 100%. The same explanation notes that engagements include actions such as likes, replies, reposts, link clicks, profile clicks, and hashtag clicks.
That means this metric measures response relative to how many times the post was displayed.
What counts in each part
In X Analytics, engagements are counted actions such as likes, replies, reposts, and clicks; impressions are the total times the post appeared on screen; and engagement rate is engagements divided by impressions, expressed as a percentage. One person can create multiple impressions or actions.
| Metric | What it means |
|---|---|
| Engagements | Actions people took on the post |
| Impressions | Total times the post appeared on screen |
| Engagement rate | Share of impressions that turned into interactions |
A few points matter in practice.
- Engagements are broader than likes. If someone clicked your profile or your link, X still counts that as engagement.
- Impressions are not unique people. One person can create multiple impressions.
- Follower count isn't the denominator here. That's why a post can perform well even on a small account if it gets shown beyond your followers.
If you want more direct social proof on individual posts, Upvote Club's Twitter like task flow is one way to support early interaction through community exchange rather than automated traffic.
A simple example without bad math
If a post earns 25 engagements from 2,000 impressions, its engagement rate is (25 ÷ 2,000) × 100 = 1.25%. Pull both totals from the same post in X Analytics so the numerator and denominator cover the same activity.
- Open the post analytics
- Find total engagements
- Find total impressions
- Divide engagements by impressions
- Multiply by 100
If a post gets more clicks than likes, that doesn't mean it failed. It means the post may be doing a job other than starting conversation.
That distinction matters a lot for developers, founders, journalists, and marketers. Some posts are built for discussion. Some are built for traffic. Both can work, but don't judge them by the wrong outcome.
How to see your engagement rate in X Analytics
X shows engagement metrics in post analytics once you have analytics access for your account. The path is straightforward:
- Open the post on X from the account that published it.
- Open View post analytics (often a bar-chart icon under the post on desktop, or via the post menu on mobile).
- Find Engagements and Impressions in the post detail view.
- Read Engagement rate if X displays it, or calculate it yourself as (engagements ÷ impressions) × 100.
If you manage many posts, also check the account-level Analytics dashboard for trends across a date range. Use the same definition every time so week-to-week comparisons stay honest.
What Is a Good Twitter Engagement Rate in 2026
At this point, many people get discouraged. They calculate the number correctly, compare it to Instagram standards, and assume their X account is broken.
It usually isn't. X is just tougher. So is 2.5% good? Yes—for most accounts on X, that is strong, not average. Is 20% good? It is exceptional, and usually reflects a small highly responsive audience or a post that went unusually deep with the right people—not a normal baseline you should expect every day.
The benchmark that resets expectations
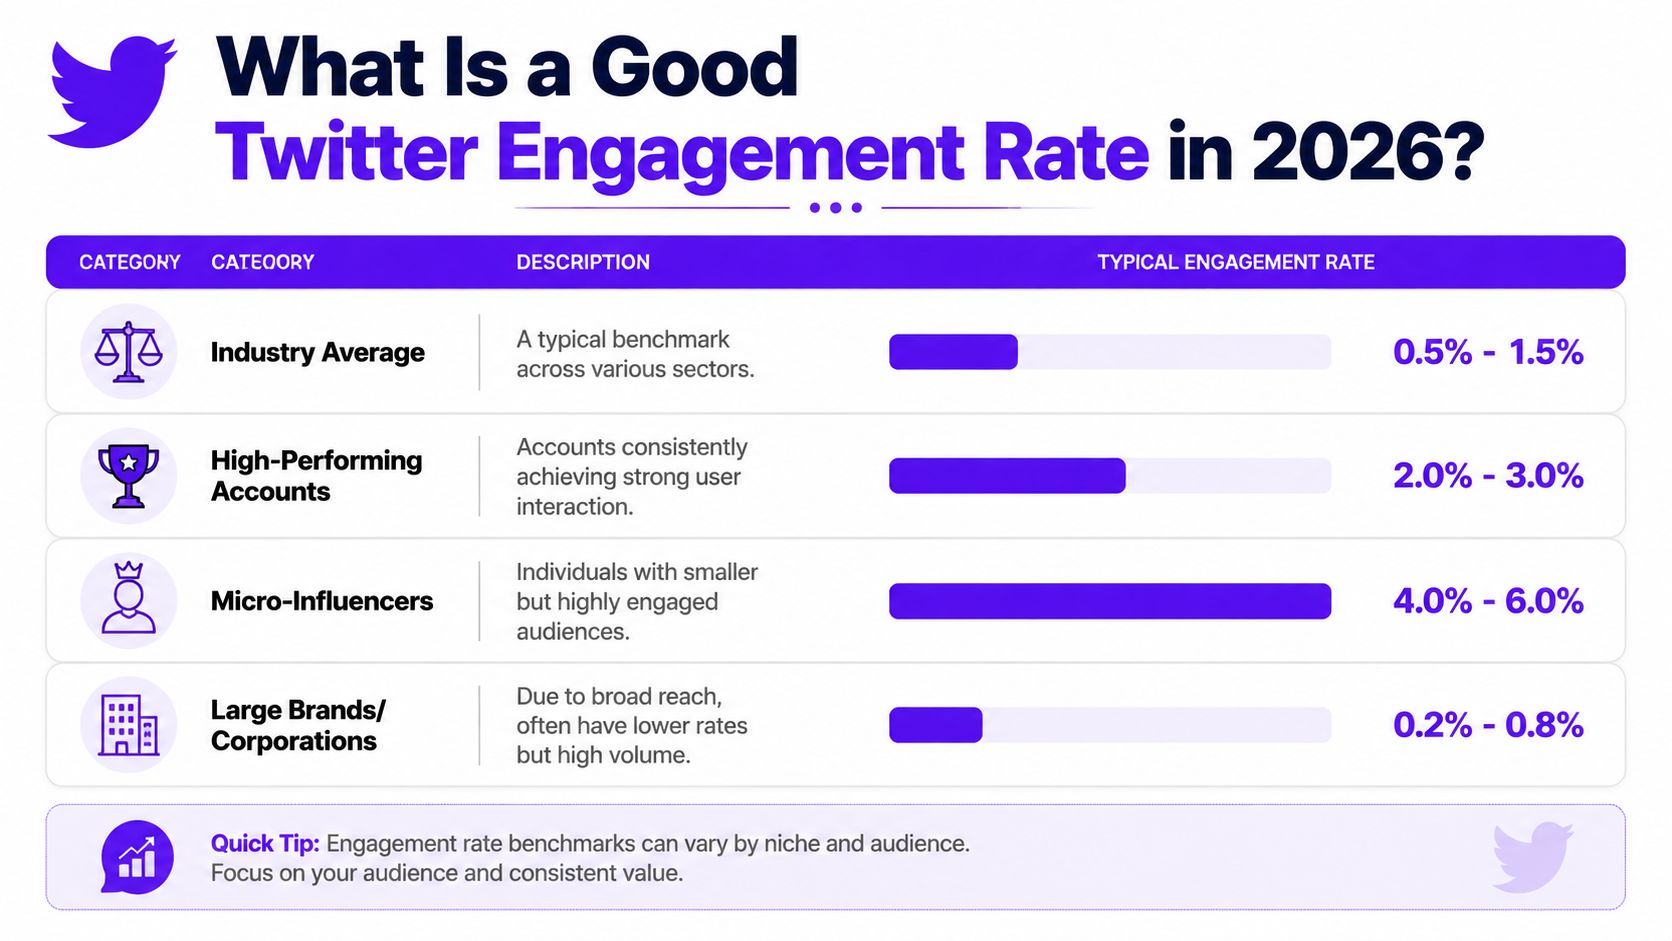
According to Rival IQ's benchmark on good Twitter engagement rates, the median Twitter engagement rate for brands in 2024 was 0.029%. That same benchmark notes that above 0.5% is generally solid and over 1% is excellent for most brands.
Those numbers change how you judge performance.
If you've been looking at a post under 1% and calling it weak by default, you may be setting the wrong standard. On X, small gains matter. Moving a post from nearly ignored to consistently discussed can produce a major gap versus the median.
For accounts trying to add audience growth alongside engagement, Upvote Club's Twitter follow tasks can sit alongside content testing as one practical option.
A practical way to read your number
As a practical 2026 frame for brands on X, about 0.03% is near the median, around 0.5% is solid, and 1%+ is excellent; strong creator posts may reach roughly 1–3%. Treat 2.5% as a clear win and 20% as exceptional rather than a routine target.
- Near the median (~0.03% for many brands): Your posts are getting seen more than they're being acted on. On X, that is a common average zone—not automatically a broken account.
- Around solid territory (~0.5%): Your hooks and topics are starting to convert views into interaction.
- In excellent territory (1%+ for brands; strong creator posts often land closer to 1–3%): You're getting response density most brand accounts never reach. Treat 2.5% as a win. Treat 20% as rare, not a default target.
That doesn't mean every post should target the same style. A breaking-news reaction post may get replies. A product update may get clicks. A contrarian opinion may get reposts but fewer likes.
Why one benchmark never tells the full story
Benchmarks are useful, but they don't replace context. Brand medians sit far below what active creators sometimes see. A creator posting sharp opinions to a warm audience may land in the 1–3% range on strong posts, while a brand broadcast account can sit near the Rival IQ median and still be healthy for its category. I've also seen accounts with flashy public reactions turn that into very little off-platform action.
Bench note: Judge your Twitter engagement rate against account type, post format, and goal. A post built to start debate should not be scored the same way as a post built to send qualified traffic.
The key is to stop asking, “Is this viral?” and start asking, “Is this strong for X, for my audience, and for this post type?”
Common Measurement Pitfalls to Avoid
The fastest way to misread performance on X is to reward exposure without checking response quality.
A lot of creators and teams do this by accident. They open analytics, see a spike in impressions, and assume the account is moving in the right direction. Sometimes it is. Sometimes the post was merely shown to more people who didn't care enough to act.
Impressions can hide weak response
Statista's year-over-year X engagement data shows a sharp version of that problem. In 2024, X post impressions were up 98.24% year over year while overall engagement fell 38.05%.
That pattern is a warning sign for day-to-day account analysis too. More views don't automatically mean stronger content. If the interaction rate drops while exposure rises, you may be getting broader distribution with weaker relevance.
Three mistakes that distort your read
The three most common measurement mistakes are judging impressions without response, treating irrelevant interaction as proof of quality, and combining different action types into one undifferentiated score. Each one can make a weak post look healthier than it is.
- Chasing impressions alone: A post with broad distribution but weak action can look better than it is.
- Counting low-quality interaction as proof: Random likes from irrelevant accounts don't help you learn what your audience wants.
- Ignoring action mix: Replies, reposts, profile clicks, and link clicks tell different stories.
If reply momentum matters for your workflow, Upvote Club's Twitter comment tasks are one example of a task-based flow built around real-user participation rather than automated activity. Saves can help the same way via Twitter save tasks when bookmark-style social proof is the goal.
Follower count is a weak excuse
People often blame low engagement on account size. That's only partly true. Larger accounts often see thinner engagement density, but even smaller accounts can underperform badly if they post generic takes, weak links, or flat statements with no reason to reply.
Here's the better question: did the post create a clear action?
If not, low engagement isn't surprising.
A post can be accurate, polished, and still fail because it gives the reader nothing to do.
Watch for audience quality too. If engagement comes from accounts that never return, never click, and never join the same topic cluster again, your numbers may look cleaner than your account is.
Data-Backed Tactics for Higher Engagement
Higher engagement on X comes from native posts with a clear curiosity gap or specific opinion, timing that overlaps with your audience's active window, and fast replies that keep the conversation moving. Test those variables by post type instead of relying on generic advice to post more or add visuals.
The sections below show how text-first formats, audience-overlap timing, narrow questions, and active reply management can turn more impressions into meaningful actions.

Text posts can still win
One of the biggest mistakes I see is forcing every post into a media-first format. That can work, but it's not automatic. The more useful rule is this: native posts that create curiosity and friction often outperform posts that immediately push people off-platform.
The verified data here is clear. Recent analytics show that text posts with a curiosity-gap hook can reach a 0.48% engagement rate, while link posts sit at 0.13%. That's a strong reminder that text-only doesn't fail because it lacks media. It fails when it says everything too early or says nothing worth responding to.
Try formats like these:
- Open-loop statement: Start with a partial conclusion that invites people to read the second line.
- Direct question: Ask for an opinion people can answer without doing homework.
- Short thread: Use a 3 to 5 post sequence when the idea needs buildup, not a screenshot dump.
Timing is now about audience overlap
“Post in the morning” is too vague to be useful if your audience spans regions.
What matters more is where your readers are and when they begin their active scroll window. For some accounts, the best slot isn't your local morning at all. It's the overlap between your primary market's workday and the next market waking up.
I like to test timing by content type:
| Post type | Best use |
|---|---|
| Question post | When your core audience is likely to reply quickly |
| Link post | When people have time to click and read |
| Thread | When you can hold attention for multiple posts |
If you want another tactical breakdown, XBurst's 2026 engagement playbook is worth reading because it focuses on practical posting habits rather than generic motivation.
What tends to work better than polished branding
Specific opinions, narrow questions, active replies, and self-contained threads tend to earn more response than polished but generic brand messaging. They give readers a clear idea to react to and a low-friction way to join the conversation.
- Specific opinions: Vague agreement gets ignored. Clear positions get replies.
- Conversation bait with substance: Ask something narrow enough to answer fast.
- Reply activity after posting: If people comment and you don't answer, you cut off momentum.
- Threads that stand alone: Each post should make sense on its own, not depend on screenshots or hidden context.
Ask for the smallest possible response. A fast reply beats a thoughtful reply that never gets written.
The Golden Hour and Community-Driven Growth
You publish a strong post, check back 20 minutes later, and it looks dead. Then an objectively weaker post from a larger account keeps picking up replies for hours. I see this all the time on X. The difference is often not content quality alone. It is whether the post got enough real interaction early to earn a wider test.
That early window changes distribution. Early replies, reposts, profile clicks, and saves give the algorithm a reason to keep showing the post to people outside your immediate followers. If nothing happens early, the platform may stop testing it before your actual audience even sees it.
Early engagement changes who gets the post
Early replies, reposts, clicks, and saves can help a post earn continued distribution beyond its initial audience, while a flat opening can cause X to stop testing it sooner. Low reach therefore does not always prove that the underlying idea was weak.
Give important posts a stronger first test by staying active, answering early comments quickly, and, when appropriate, adding community interaction from people already active on the platform. That support typically lands within hours—not as a guaranteed delivery SLA tied to a fixed sixty-minute clock.
In practice, it is a simple system. Get a post in front of an engaged community soon enough to create a real first wave, then let the platform decide whether it deserves more reach.
A community model works differently from fake engagement
Upvote Club uses a community exchange model. People complete actions for each other, and participation is tied to real participant accounts rather than automated volume or password-based account access.
That trade-off matters. You will not get the artificial scale that sketchy growth services promise, but you do get something more useful: visible early activity from actual users while the post is still being tested for wider distribution. For accounts that are still building reach, that can be enough to move a post from "missed the feed" to "got a real test."
I would use this approach selectively. It is best for posts that already have a sharp point of view, a clear hook, or a discussion angle likely to hold attention once the first comments arrive. It will not save bland content. It can help strong content avoid dying in silence.
When community-driven support makes sense
Community-driven support makes sense for a high-upside post with a clear hook when you can stay present to manage replies and want real human participation to test distribution. It is a poor fit when the goal is anonymous volume or when the content gives people no useful reason to respond.
- The post has clear upside: a launch, contrarian take, timely thread, or high-value question
- You can actively manage replies: early interaction works better when the original poster stays present
- You want human participation: you can see who engaged instead of buying anonymous volume
- You care about testing distribution, not inflating vanity metrics: the goal is reach and conversation quality
This also pairs well with sentiment tracking. If a post gets traction fast, Grok 4 for real-time X sentiment can help you monitor whether the response is positive, skeptical, or drifting off-topic while the discussion is still forming.
The useful mindset is simple. Treat the early window as a live distribution test. If the post matters, support that test with active replies and a real community around it. That is how smaller accounts compete without fake screenshots or handing their account to an agency.
Tracking Your Progress and Adjusting Your Strategy
The accounts that improve don't just post more. They review patterns.
You need a feedback loop that's small enough to maintain and clear enough to trust. That usually means checking individual post analytics, grouping posts by format, and asking what kind of engagement each one was meant to produce.
Build a repeatable review habit
Build a repeatable review habit by tagging each post by format, checking which actions it earned, and comparing it only with posts designed for the same goal. Repeat this process on a consistent schedule so patterns are based on comparable data rather than isolated winners.
Tag the post type
Mark it as question, opinion, link, thread, update, or media post.Check the action mix
Look beyond likes. Was the post getting replies, profile clicks, or reposts?Compare similar posts only
Don't compare a traffic post to a discussion post and call one “better” without context.
A plain spreadsheet works. So does your notes app. What matters is consistency.
Watch the audience signal, not just the score
A post with average engagement can still be useful if it attracts the right people into your replies or profile. If sentiment matters to your work, product launches, or reporting rhythm, Grok 4 for real-time X sentiment is a useful resource for tracking what people are saying around fast-moving topics.
Track themes, not just winners. If three posts on one topic all outperform your normal baseline, that's a content lane, not a fluke.
The best adjustment cycle is boring on purpose. Post. Measure. Sort by format. Keep what earns response. Cut what gets seen and ignored.
If you want a practical way to support early momentum on X through community exchange, Upvote Club gives you a system for likes, comments, followers, and saves—without requiring passwords.